An almost incomprehensible amount of data is created every day.
And each year, figures are growing at an ever-increasing rate.
We’ll dive into the most recent statistics and projections below. All data below was sourced in February 2026.
Top Data Created Stats (Editor's Choice)
- Approximately 402.74 million terabytes of data are created each day
- Around 221 zettabytes of data is expected to be generated in 2026
- 181 zettabytes of data were generated in 2025
- Videos account for ~82% of internet data traffic
- The US has more than 4,000 data centers
How Much Data Is Generated Every Day?
According to the latest estimates, 402.74 million terabytes of data are created each day.
(“Created” includes data that is newly generated, captured, copied, or consumed).
In zettabytes, that equates to around 147 zettabytes per year, around 12 zettabytes per month, 2.8 zettabytes per week, or 0.4 zettabytes every day.
To put that into perspective, this is how much data is generated per day in various units of measurement:
|
Unit of Measurement |
Data Generated |
|
Zettabytes |
0.4 |
|
Exabytes |
402.74 |
|
Petabytes |
402,740 |
|
Terabytes |
402.74 million |
|
Gigabytes |
402.74 billion |
|
Megabytes |
402.74 trillion |
|
Kilobytes |
402.74 quadrillion |
|
Bytes |
402.74 quintillion |
Source: Statista
Data Creation Growth Projections
The amount of data generated annually has grown year-over-year since 2010.
In fact, it is estimated that 90% of the world's data was generated in the last two years alone.
In the space of 13 years, this figure has increased by an estimated 74x from just 2 zettabytes in 2010.
The 120 zettabytes generated in 2023 are expected to increase by over 150% for 2025, hitting 181 zettabytes.
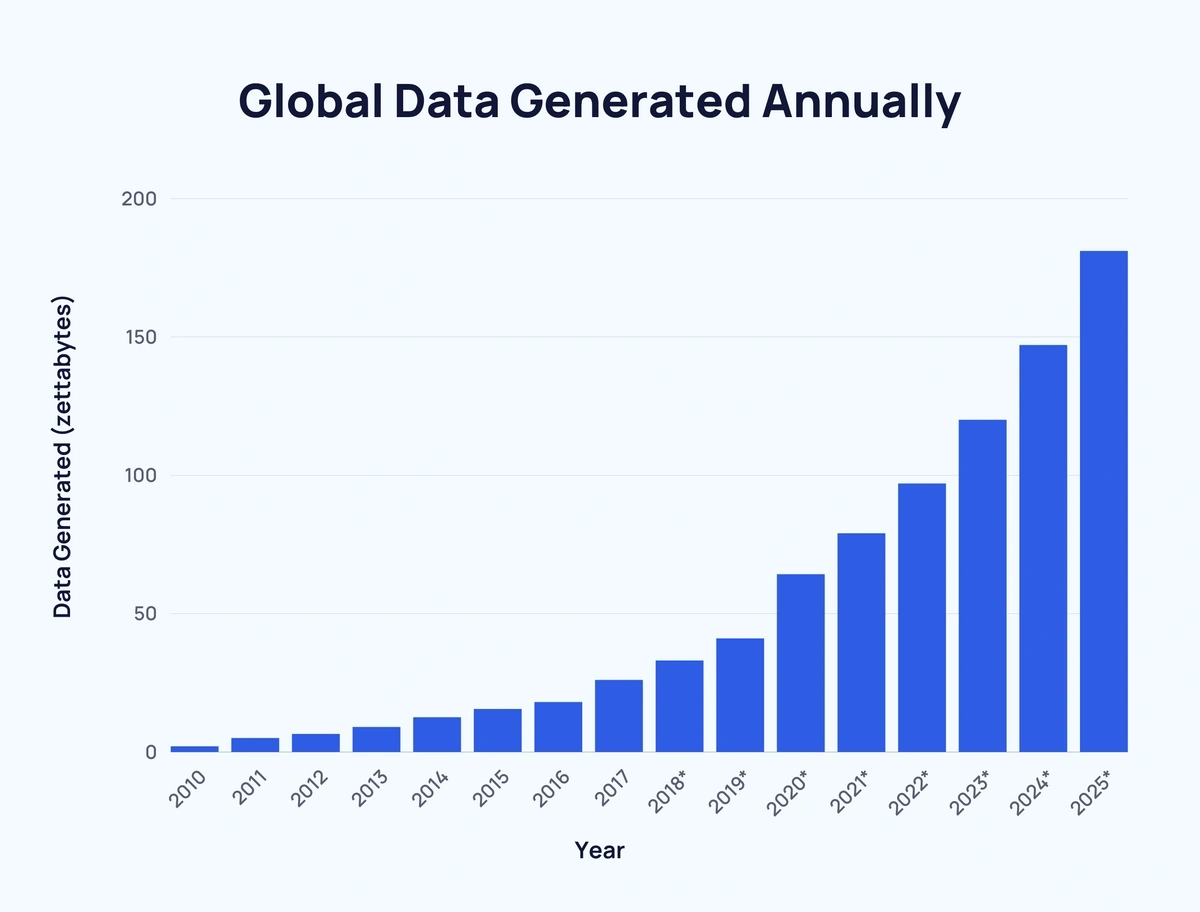
Here’s a full breakdown of how much data has been generated each year from 2010 to 2025 (estimated):
|
Year |
Data Generated |
Change Over Previous Year |
Change Over Previous Year (%) |
|
2010 |
2 zettabytes |
- |
- |
|
2011 |
5 zettabytes |
↑ 3 zettabytes |
↑ 150% |
|
2012 |
6.5 zettabytes |
↑ 1.5 zettabytes |
↑ 30% |
|
2013 |
9 zettabytes |
↑ 2.5 zettabytes |
↑ 38.46% |
|
2014 |
12.5 zettabytes |
↑ 3.5 zettabytes |
↑ 38.89% |
|
2015 |
15.5 zettabytes |
↑ 3 zettabytes |
↑ 24% |
|
2016 |
18 zettabytes |
↑ 2.5 zettabytes |
↑ 16.13% |
|
2017 |
26 zettabytes |
↑ 8 zettabytes |
↑ 44.44% |
|
2018* |
33 zettabytes |
↑ 7 zettabytes |
↑ 26.92% |
|
2019* |
41 zettabytes |
↑ 8 zettabytes |
↑ 24.24% |
|
2020* |
64.2 zettabytes |
↑ 23.2 zettabytes |
↑ 56.59% |
|
2021* |
79 zettabytes |
↑ 14.8 zettabytes |
↑ 23.05% |
|
2022* |
97 zettabytes |
↑ 18 zettabytes |
↑ 22.78% |
|
2023* |
120 zettabytes |
↑ 23 zettabytes |
↑ 23.71% |
|
2024* |
147 zettabytes |
↑ 27 zettabytes |
↑ 22.5% |
|
2025* |
181 zettabytes |
↑ 34 zettabytes |
↑ 23.13% |
Source: Statista, Bernard Marr & Co.
Data Creation by Category
Video is responsible for about 82% of all global data traffic. (DemandSage)
Social media is brimming with video content. TikTok is entirely based on videos and continues to grow its user base year-over-year.
While Facebook has evolved to the point where 19% of content shared on the platform is video-based.
Although public data related to Snapchat is limited, estimates show that a single Snap photo without a filter uses about 1MB of data. Photos with filters can use 2-3MB of data, and a 10-second video can use 2-5MB. (Bitjoy)
Together with social (8%) and gaming (7%), these three categories make up more than 97% of all internet data traffic.
According to Venngage, an estimated 347.3 billion emails are sent per day. This averages out to about 241.2 million emails per minute.
Here’s a selection of other user-generated internet content stats:
|
Type of Media |
Amount per Minute |
Amount per Day |
|
Emails sent |
241.2 million |
347.3 billion |
|
Texts sent |
17.86 million |
25 billion |
|
Google searches |
11.7 million |
16.4 billion |
|
Snaps shared on Snapchat |
3.4 million |
4.7 billion |
|
Pieces of content shared on Facebook |
250,000 |
350 million |
|
USD spent on Amazon |
1.1 million |
1.6 billion |
|
Tweets shared on Twitter |
360,000 |
500 million |
YouTube
Watching YouTube videos in 480p resolution uses around 600 MB of data per hour.
While 4k YouTube videos use around 30x more.
Here’s the breakdown:
|
YouTube Video Quality |
Data Used per Hour |
Data Used per Day |
|
480p |
600MB |
14.4GB |
|
720p |
1.95GB |
46.8GB |
|
1080p |
3.3GB |
79.2GB |
|
4k |
13.3GB |
319.2GB |
Source
Spotify
Default Spotify settings use 2MB+ per 3-minute song.
That’s 40MB every hour or 960MB per day.
Netflix
Each standard-definition Netflix stream uses 1GB of data per hour (24GB per day).
High-definition Netflix streams can use as much as 3GB of data each hour (72GB per day).
Ultra HD uses 7GB per hour (168GB per day).
Sources: Sandvine, Domo, TechJury, iNews
Data Creation by Region
The US has over 10x more data centers (5,426) than any other country.
Germany (529), the UK (523), China (449), and Canada (337) make up the rest of the top five.
Here are the top 15 nations by data centers worldwide:
|
Rank |
Country |
Region |
Number of Data Centers |
|
1 |
US |
North America |
4,028 |
|
2 |
UK |
Europe |
509 |
|
3 |
Germany |
Europe |
479 |
|
4 |
China |
Asia |
368 |
|
5 |
France |
Europe |
342 |
|
6 |
Canda |
North America |
288 |
|
7 |
India |
Asia |
277 |
|
8 |
Australia |
Oceania |
268 |
|
9 |
Japan |
Asia |
255 |
|
10 |
Italy |
Europe |
207 |
|
11 |
Brazil |
South America |
199 |
|
12 |
Spain |
Europe |
192 |
|
13 |
The Netherlands |
Europe |
186 |
|
14 |
Indonesia |
Asia |
185 |
|
15 |
Russia |
Europe/Asia |
181 |
Source: Data Center Map
Key Takeaways
Data generation is currently skyrocketing.
And with every passing year, we are seeing these figures reach new highs.
If you enjoyed these stats, take a look at Key Data Science Trends and Important Computer Science Trends.