In a relatively short period of time, smartphones have grown to a near-ubiquitous status.
With each new release, smartphones are becoming more powerful and all-encompassing. Understandably, this is leading to increased user adoption and a surge in daily screen time.
We’ll explore the statistics around smartphone screen time.
Time Spent on Smartphone Stats 2026 (Editor’s Picks)
Here are some highlights from this smartphone stats page:
- On average, people spend 4 hours and 37 minutes on their phones each day.
- Individuals check their phones an average of 58 times each day.
- Americans now spend an average of 5 hours and 16 minutes on their phone, a 14% YoY increase
- Ghanaians spend the longest amount of time on their phones each day.
- Japanese citizens spend under half of the global average time on their smartphones.
- 3 in 4 Gen Zers claim to spend too much time on their smartphones.
For further context and more data, keep reading.
Time Spent Using Smartphones Annually
According to recent data, the average person spends 4 hours and 37 minutes on their phone every day. That's the equivalent of over 1 day per week or 6 days per month. Across a year, that's approximately 70 days spent looking at a phone.
Perhaps surprisingly, weekdays average more smartphone use than weekends. On average, people check their phones 58 times per day. And almost 52% of phone checks (30 per day) occur during work hours.
Picking your phone up can become a habit, as data shows that half of all screen time sessions begin within 3 minutes of the last.
Here’s a breakdown of time spent on smartphones by pick-up:
| Time Spent on Smartphone | Average Amount of Times Per Day | Percentage of Daily Pick-Ups |
| Less Than 2 Minutes | 40 | 69% |
| 2 to 10 Minutes | 15 | 26% |
| 10+ Minutes | 3 | 5% |
Across the day, the mean time spent on a smartphone per pick-up is around 1 minute 15 seconds.
Sources: Harmony Healthcare IT, Rescue Time
Time Spent Using Smartphones by Region
Data from Q3 2024 shows that Ghanaians spend over 5 hours and 43 minutes per day on their smartphones.
In total, 5 countries exceed 5 hours of screen time per day on their phones. And 21 nations examined exceeded the average for Q3 2024 (3 hours 46 minutes).
Remarkably, 4 South American nations feature in the top 10. While 3 South-East Asian countries also make up the top 10.
Here’s the full breakdown of each nation’s daily smartphone use in hours and minutes:
| Rank | Country | Continent | Time Spent on Smartphone per Day (Q3 2024) | Time Spent on Smartphone per Day (Q3 2023) | Change Over Previous Year |
| 1 | Ghana | Africa | 5 hours and 43 minutes | 4 hours and 58 minutes | ↑ 45 minutes |
| 2 | Philippines | Asia | 5 hours and 21 minutes | 5 hours and 20 minutes | ↑ 1 minute |
| 3 | Brazil | South America | 5 hours and 12 minutes | 5 hours and 19 minutes | ↓ 7 minutes |
| 4 | South Africa | Africa | 5 hours and 11 minutes | 5 hours and 15 minutes | ↓ 4 minutes |
| 5 | Thailand | Asia | 5 hours | 5 hours and 2 minutes | ↓ 2 minutes |
| 6 | Chile | South America | 4 hours and 58 minutes | 4 hours and 48 minutes | ↑ 10 minutes |
| 7 | Kenya | Africa | 4 hours and 57 minutes | 4 hours and 36 minutes | ↑ 21 minutes |
| 8 | Colombia | South America | 4 hours and 47 minutes | 4 hours and 47 minutes | – |
| 9 | Malaysia | Asia | 4 hours and 42 minutes | 4 hours and 37 minutes | ↑ 5 minutes |
| 10 | Argentina | South America | 4 hours and 40 minutes | 4 hours and 37 minutes | ↑ 3 minutes |
| 11 | Indonesia | Asia | 4 hours and 38 minutes | 4 hours and 45 minutes | ↓ 7 minutes |
| 12 | UAE | Asia | 4 hours and 27 minutes | 4 hours and 34 minutes | ↓ 7 minutes |
| 13 | Mexico | North America | 4 hours and 20 minutes | 4 hours and 23 minutes | ↓ 3 minutes |
| 14 | Saudi Arabia | Asia | 4 hours and 17 minutes | 4 hours and 23 minutes | ↓ 6 minutes |
| =15 | Egypt | Africa | 4 hours and 9 minutes | 4 hours and 25 minutes | ↓ 16 minutes |
| =15 | Taiwan | Asia | 4 hours and 9 minutes | 4 hours and 5 minutes | ↑ 4 minutes |
| 17 | Russia | Europe/Asia | 4 hours and 7 minutes | 3 hours and 56 minutes | ↑ 11 minutes |
| 18 | Turkey | Europe/Asia | 4 hours and 4 minutes | 4 hours and 7 minutes | ↓ 3 minutes |
| 19 | India | Asia | 3 hours and 57 minutes | 4 hours and 3 minutes | ↓ 6 minutes |
| 20 | Israel | Asia | 3 hours and 53 minutes | 3 hours and 52 minutes | ↑ 1 minute |
| 21 | Nigeria | Africa | 3 hours and 49 minutes | 4 hours and 20 minutes | ↑ 29 minutes |
| - | Global Average | - | 3 hours and 46 minutes | 3 hours and 50 minutes | - |
| 22 | Bulgaria | Europe | 3 hours and 44 minutes | 3 hours and 49 minutes | ↓ 5 minutes |
| =23 | Serbia | Europe | 3 hours and 40 minutes | – | – |
| =23 | Romania | Europe | 3 hours and 40 minutes | 3 hours and 51 minutes | ↓ 11 minutes |
| 25 | Portugal | Europe | 3 hours and 38 minutes | 3 hours and 33 minutes | ↑ 5 minutes |
| 26 | China | Asia | 3 hours and 32 minutes | 3 hours and 31 minutes | ↑ 1 minute |
| 27 | Morocco | Africa | 3 hours and 25 minutes | 2 hours and 21 minutes | ↑ 4 minutes |
| 28 | US | North America | 3 hours and 22 minutes | 3 hours and 39 minutes | ↓ 17 minutes |
| 29 | Croatia | Europe | 3 hours and 21 minutes | 3 hours and 17 minutes | ↑ 4 minutes |
| 30 | Vietnam | Asia | 3 hours and 20 minutes | 3 hours and 30 minutes | ↓ 10 minutes |
| 31 | Poland | Europe | 3 hours and 18 minutes | 3 hours and 5 minutes | ↑ 13 minutes |
| =32 | New Zealand | Oceania | 3 hours and 17 minutes | 3 hours and 13 minutes | ↑ 4 minutes |
| =32 | Singapore | Asia | 3 hours and 17 minutes | 3 hours and 26 minutes | ↓ 9 minutes |
| 34 | Sweden | Europe | 3 hours and 13 minutes | 3 hours and 10 minutes | ↑ 3 minutes |
| 35 | Ireland | Europe | 3 hours and 11 minutes | 3 hours and 15 minutes | ↓ 4 minutes |
| 36 | Norway | Europe | 3 hours and 2 minutes | 2 hours and 58 minutes | ↑ 4 minutes |
| 37 | Hungary | Europe | 3 hours | 3 hours and 14 minutes | ↓ 14 minutes |
| 38 | Australia | Oceania | 2 hours and 58 minutes | 2 hours and 56 minutes | ↓ 2 minutes |
| 39 | Netherlands | Europe | 2 hours and 55 minutes | 2 hours and 46 minutes | ↑ 9 minutes |
| 40 | Czechia | Europe | 2 hours and 55 minutes | 2 hours and 56 minutes | ↓ 1 minute |
| =41 | Hong Kong | Asia | 2 hours and 54 minutes | 3 hours and 17 minutes | ↓ 23 minutes |
| =41 | Italy | Europe | 2 hours and 54 minutes | 2 hours and 57 minutes | ↓ 3 minutes |
| =41 | Spain | Europe | 2 hours and 54 minutes | 2 hours and 53 minutes | ↑ 1 minute |
| 44 | Canada | North America | 2 hours and 46 minutes | 2 hours and 59 minutes | ↓ 13 minutes |
| 45 | Switzerland | Europe | 2 hours and 44 minutes | 2 hours and 38 minutes | ↑ 6 minutes |
| =46 | Greece | Europe | 2 hours and 43 minutes | 2 hours and 54 minutes | ↓ 11 minutes |
| =46 | South Korea | Asia | 2 hours and 43 minutes | 2 hours and 43 minutes | – |
| 48 | Germany | Europe | 2 hours and 42 minutes | 2 hours and 36 minutes | ↑ 6 minutes |
| =49 | UK | Europe | 2 hours and 39 minutes | 2 hours and 57 minutes | ↓ 18 minutes |
| =49 | Austria | Europe | 2 hours and 39 minutes | 2 hours and 41 minutes | ↓ 2 minutes |
| 50 | France | Europe | 2 hours and 34 minutes | 2 hours and 34 minutes | – |
| 51 | Belgium | Europe | 2 hours and 32 minutes | 2 hours and 26 minutes | ↑ 6 minutes |
| 52 | Denmark | Europe | 2 hours and 27 minutes | 2 hours and 24 minutes | ↑ 3 minutes |
| 53 | Japan | Asia | 1 hour and 47 minutes | 1 hour and 54 minutes | ↓ 7 minutes |
Source: DataReportal
Smartphone Use in the US
The latest study focusing on American smartphone users found that people in US are spending a daily average of 5 hours and 16 minutes on their phones.
This is a 14% increase from an average of 4 hours 37 minutes reported by the same study for 2024.
Roughly, this translates to 80 full days that Americans are glued to their screen yearly, from an average of 70 days the prior year.
Around 53% of Americans aim to cut down on their smartphone use. This represents a 33% increase from 2023.
Split by age, there is a correlation between generation and phone screen time:
| Generation | Average Daily Screen Time |
| Gen Z | 6 hours and 27 minutes |
| Millennial | 5 hours and 28 minutes |
| Gen Z | 4 hours and 48 minutes |
| Baby Boomers | 4 hours and 19 minutes |
A recent study found that, on average, children get their first phone at age 12. That means that the average American is expected to spend approximately 12 years of their life looking at their phone.
More than half of Americans believe they are too dependent on their phones (52%). As many as 3 in 5 (59%) use their phones on the toilet, while 27% will text when at stoplights.
Time spent on non-voice activities continues to rise in the US. Between 2019 and 2024, the amount of time spent on daily mobile phone use has risen from 3 hours and 45 minutes to 4 hours and 49 minutes, according to eMarketer.
Here's a breakdown of that change over time:
| Year | Time Spent on Non-Voice Mobile Phone Use |
| 2019 | 3 hours and 45 minutes |
| 2020 | 4 hours and 16 minutes |
| 2021 | 4 hours and 24 minutes |
| 2022 | 4 hours and 30 minutes |
| 2023* | 4 hours and 36 minutes |
| 2024* | 4 hours and 49 minutes |
*Projected figures.
Sources: Harmony Healthcare IT, Stanford Medicine, eMarketer
Time Spent Using Smartphones by Demographic
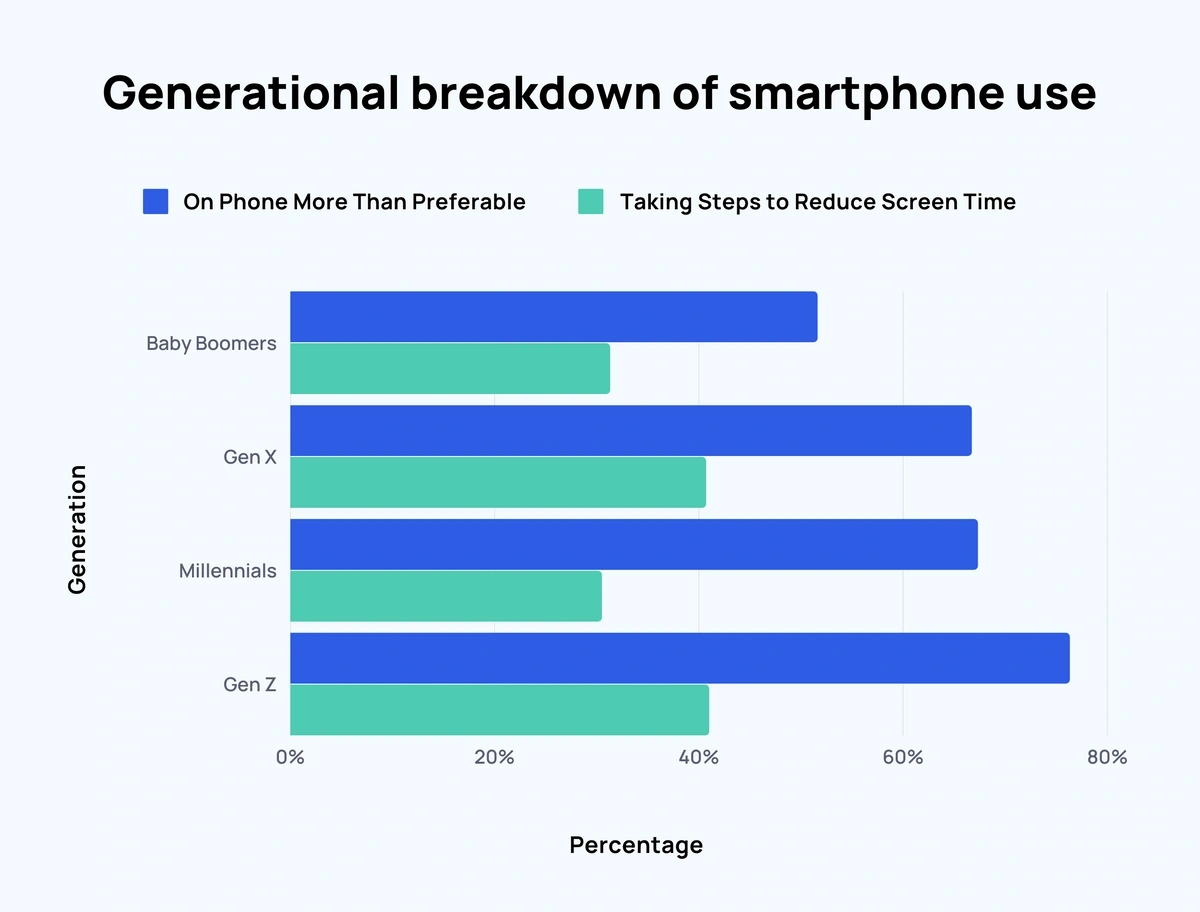
Around 3 in 4 Gen Zers admit to spending more time on their smartphones than they would like each day. By comparison, just over half of the Baby Boomers feel the same way.
In fact, 24% of Gen Z respondents claimed that smartphone overuse had become a problem in their lives. And 41% of Gen Zers claim to be actively taking steps towards reducing their screen time.
Here is the generational breakdown of smartphone use:
| Generation | On Phone More Than Preferable | Taking Steps to Reduce Screen Time |
| Baby Boomers | 51.6% | 31.3% |
| Gen X | 66.7% | 40.7% |
| Millennials | 67.3% | 30.5% |
| Gen Z | 76.3% | 41% |
Another research study found that females are more likely to use smartphones for longer durations of time than males. From a sample of over 30,000 people, the daily average smartphone screen time for females was approximately 2 hours and 47 minutes, compared to 2 hours and 34 minutes for males.
This corroborates findings from a 2022 paper that asked respondents if they spend more time on their smartphones than their partners.
In total, 78% of females claim to spend more time on their smartphones than their partners.
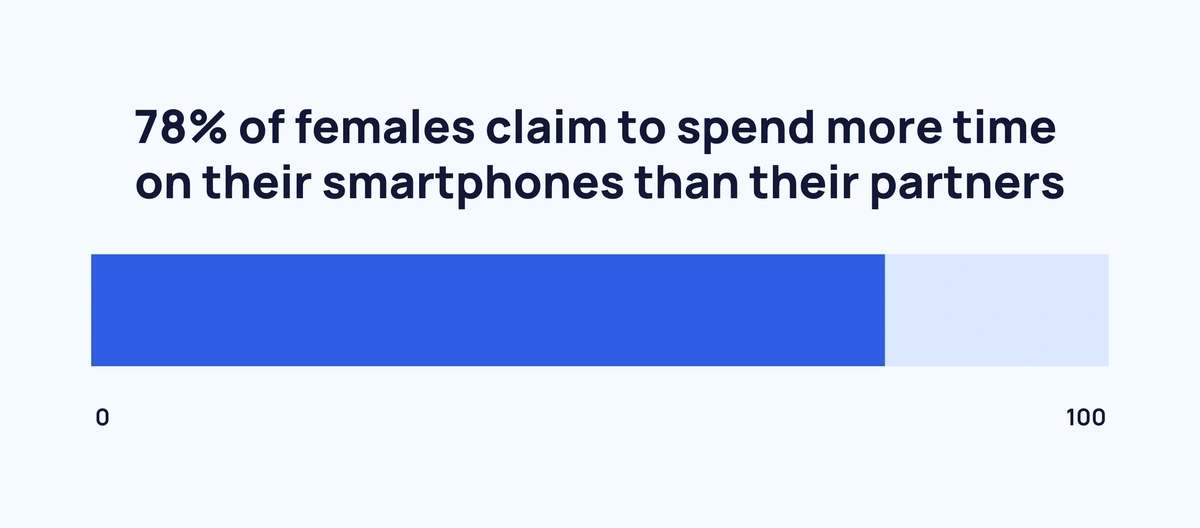
And although the majority of males asked also believe they spend more time on their smartphones than their partners, a lower proportion claimed to do so (64%).
Sources: SimpleTexting, ResearchGate, SellCell
How Time is Spent on Smartphones
Unsurprisingly, using smartphones to access the internet has become increasingly commonplace.
In 2014, just under 1/3rd of time on smartphones was spent using the internet. By 2019, internet usage accounted for more than half of the time spent on smartphones. And this figure continues to grow.
Here’s a look at internet usage as a share of total time spent on smartphones since 2013:
| Quarter | Share of Time Spent on Smartphones | Percentage Change Over Previous Year |
| Q3 2013 | 27.3% | - |
| Q3 2014 | 33.1% | ↑ 5.8% |
| Q3 2015 | 37.7% | ↑ 4.6% |
| Q3 2016 | 39.1% | ↑ 1.4% |
| Q3 2017 | 45.6% | ↑ 6.5% |
| Q3 2018 | 49.4% | ↑ 3.8% |
| Q3 2019 | 50.8% | ↑ 1.4% |
| Q3 2020 | 52.8% | ↑ 2% |
| Q3 2021 | 53.5% | ↑ 0.7% |
| Q3 2022 | 56.9% | ↑ 3.4% |
| Q3 2023 | 57.6% | ↑ 0.7% |
The raw minutes spent accessing the internet via smartphones have also risen year-over-year during the last decade.
In 2011, this figure accounted for just over half an hour (32 minutes). By 2014, this had almost doubled, reaching 1 hour and 3 minutes. And as of 2023, the average daily time spent using the internet on a smartphone was approximately 3 hours and 50 minutes.
This rise coincides with the steady decline of internet usage via desktop.
Here’s a closer look at internet usage by the device since 2011:
| Year | Desktop Internet Use | Mobile Internet Use | Mobile Internet Use Change Over Previous Year | Difference Between Desktop and Mobile Internet Use |
| 2011 | 43 mins | 32 mins | - | Desktop +11 mins |
| 2012 | 47 mins | 36 mins | ↑ 4 mins | Desktop +11 mins |
| 2013 | 49 mins | 45 mins | ↑ 9 mins | Desktop +4 mins |
| 2014 | 47 mins | 1 hour 3 mins | ↑ 18 mins | Mobile +16 mins |
| 2015 | 42 mins | 1 hour 21 mins | ↑ 18 mins | Mobile +39 mins |
| 2016 | 40 mins | 1 hour 34 mins | ↑ 13 mins | Mobile +54 mins |
| 2017 | 42 mins | 1 hour 49 mins | ↑ 15 mins | Mobile +1 hour 7 mins |
| 2018 | 39 mins | 2 hours 2 mins | ↑ 13 mins | Mobile +1 hour 23 mins |
| 2019 | 39 mins | 2 hours 12 mins | ↑ 11 mins | Mobile +1 hour 33 mins |
| 2020 | 38 mins | 2 hours 23 mins | ↑ 11 mins | Mobile +1 hour 45 mins |
| 2021 | 37 mins | 2 hours 35 mins | ↑ 12 mins | Mobile +1 hour 58 mins |
| 2022* | 2 hours 51 mins | 3 hours 46 mins | ↑ 1 hour 11 mins | Mobile +55 mins |
| 2023* | 2 hours 50 mins | 3 hours 50 mins | ↑ 4 mins | Mobile +1 hour |
*Change in methodology.
Social media is a huge part of both smartphone and internet use.
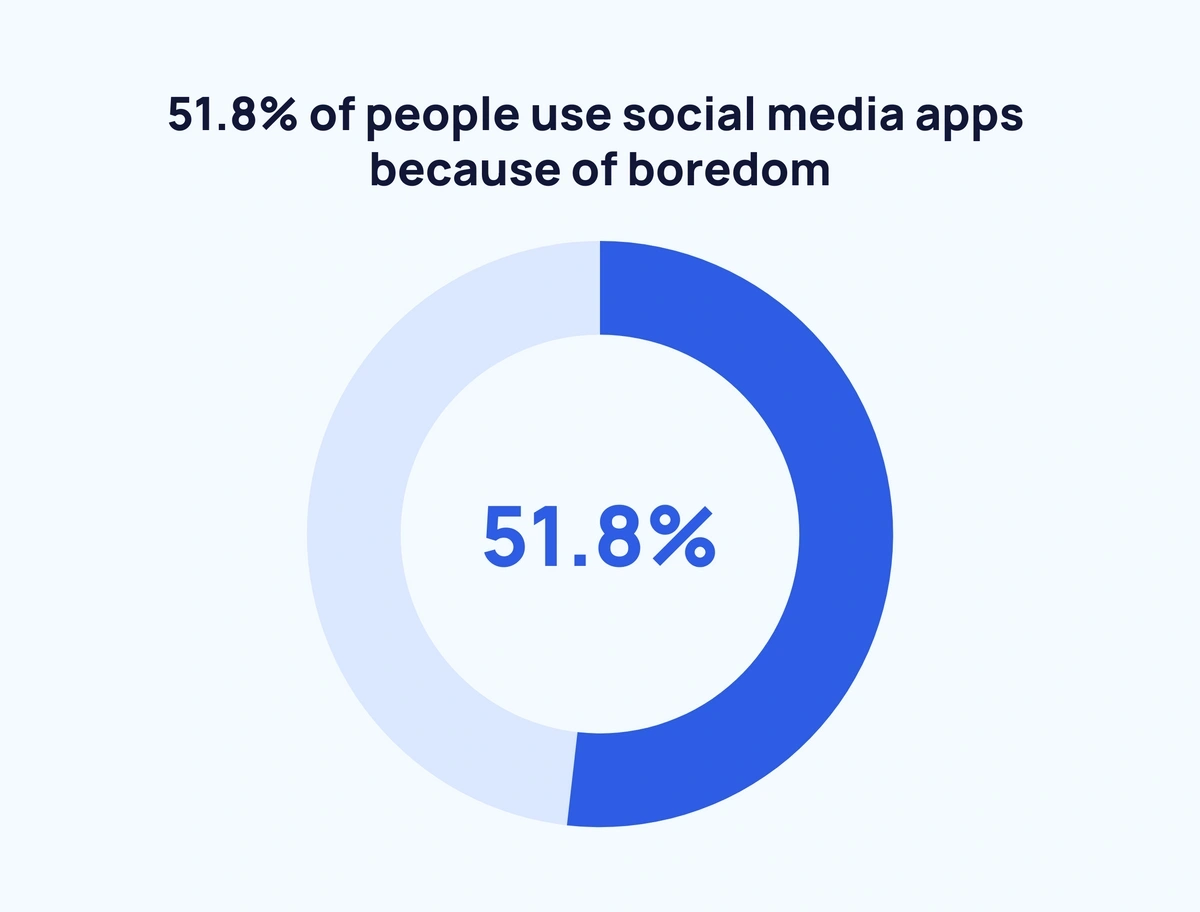
According to research, the main reason people use social media apps is boredom (51.8%).
Other reasons for using smartphones to access social media include:
- Curiosity – 18.6%
- Information – 16%
- Loneliness – 9.4%
- Necessity/Work – 3.8%
- Health purposes – 0.4%
Sources: DataReportal, Zenith, SimpleTexting
Smartphone Use Perceived Effects
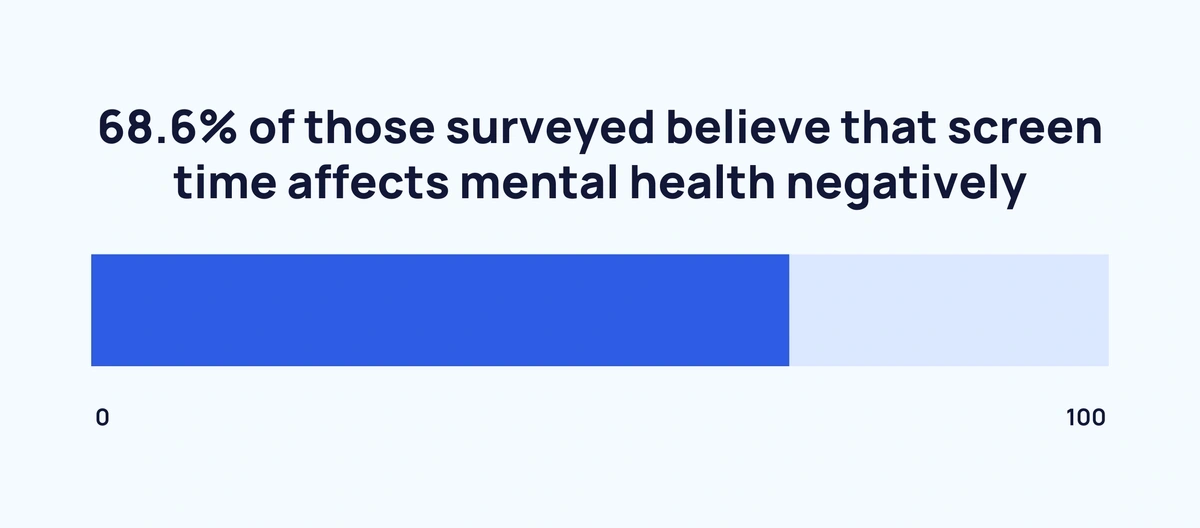
Despite increasing daily smartphone use, only around 1 in 10 people (10.3%) believe screen time has a positive effect on mental health.
By contrast, 68.6% of those surveyed believe that screen time affects mental health negatively.
The same study asked respondents what things they associate with screen time. The response with the highest proportion of agreement (54.7%) was that screen time is associated with eye strain.
Results show a mixed bag of both positive and negative associations:
| Screen Time Effect | Positive/Negative | Respondents Who Accept an Association |
| Eye strain | Negative | 54.7% |
| Being more informed | Positive | 54.1% |
| Not getting work done | Negative | 50.3% |
| Feeling more connected | Positive | 48.1% |
| Trouble paying attention | Negative | 42.8% |
| Wider worldview | Positive | 36.6% |
| Anxiety | Negative | 29.5% |
| Back issues | Negative | 25.9% |
| Feeling less connected | Negative | 22.6% |
| Depression | Negative | 21.0% |
| Being more productive | Positive | 18.4% |
| Narrower worldview | Negative | 6.1% |
| None of the above | Neutral | 4.8% |
Source: SimpleTexting
Smartphone Use Projections
The $1 trillion+ global mobile industry continues to grow each year.
Smartphone users have risen year over year since 2016 and are projected to continue on that upward trajectory for at least another half-decade.
There were approximately 3.67 billion smartphone subscriptions worldwide as of 2016.
This number has increased by between 300 million and 800 million each year. And hit an estimated 6.57 billion in 2022.
By 2027, there will be an estimated 7.69 billion smartphone subscriptions – just 200 million shy of the current global population.
Given these projections and the above data, increased smartphone screen time for the foreseeable future appears almost inevitable.
Sources: GSMA, Ericsson
Key Takeaways
Screen time is evidently on the rise.
Whether that’s positive or negative is debatable, but globally, it is an undeniable fact.
Naturally, we will reach a plateau, but there is little to indicate that this will arrive in the coming years.
For more related content, check out Mobile App Development Trends and In-Demand Mobile App Startups.