Music streaming has completely changed the music industry.
In fact, in 2026, the vast majority of music listeners now rely on music streaming platforms.
The following report will dive into some of the most important industry statistics.
Music Streaming Services (Top Stats)
- Music streaming makes up 84% of music industry revenue
- Music streaming’s global revenue currently sits at $20.4 billion
- The US added 6.3 million new paid music streaming subscribers in the last year
- Paid music streaming makes up 23% of all music streaming
- Over 800 million people worldwide subscribe to a paid music streaming platform
- The average American listens to more than 27 hours of audio per week
- Spotify is the leading music streaming service, with over 280 million paid subscribers
Music Streaming Industry
Music streaming accounts for 84% of total music industry revenue (RIAA)
Data published in September last year shows that the music industry is heavily reliant on streaming.
There were 6.3 million new paid subscribers to music streaming services in the US last year (Music Business Worldwide)
In the year to September 2025, paid services like Spotify Premium added 6.3 million net users, growing to a total of 105.3 million US users.
A year previously, paid music streaming services added just 2.5 million net users.
Music streaming revenue has surpassed $20 billion annually (IFPI)
Revenue from music streaming has grown year over year since the mid-2000s.
Between 2010 and 2020, revenue increased by around 34x from $0.4 billion to $13.6 billion.
And in 2024, the most recent available data at time of publication, music streaming revenue stood at approximately $20.4 billion.
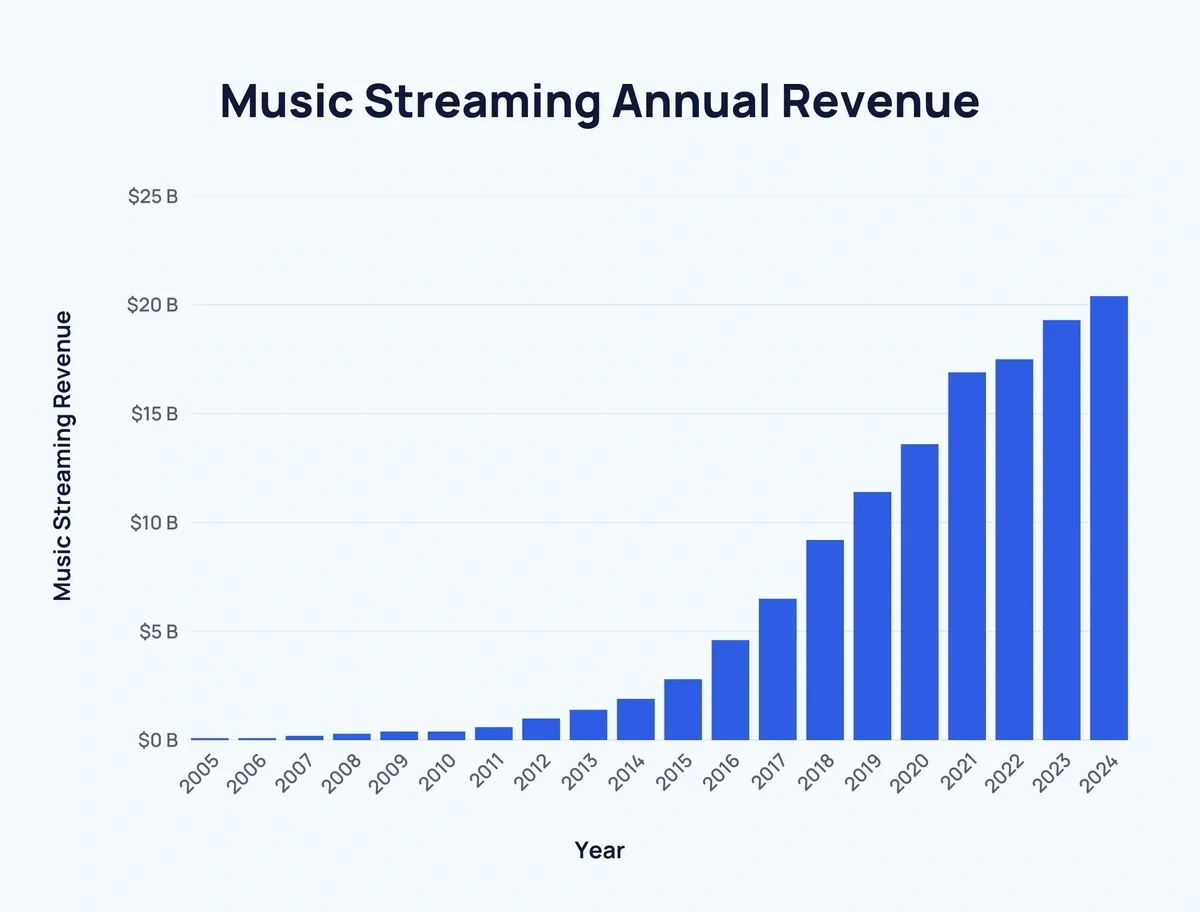
Here’s a look at how music streaming revenue has increased over time:
| Year | Music Streaming Revenue |
| 2005 | $0.1 billion |
| 2006 | $0.1 billion |
| 2007 | $0.2 billion |
| 2008 | $0.3 billion |
| 2009 | $0.4 billion |
| 2010 | $0.4 billion |
| 2011 | $0.6 billion |
| 2012 | $1 billion |
| 2013 | $1.4 billion |
| 2014 | $1.9 billion |
| 2015 | $2.8 billion |
| 2016 | $4.6 billion |
| 2017 | $6.5 billion |
| 2018 | $9.2 billion |
| 2019 | $11.4 billion |
| 2020 | $13.6 billion |
| 2021 | $16.9 billion |
| 2022 | $17.5 billion |
| 2023 | $19.3 billion |
| 2024 | $20.4 billion |
The Recording Industry Association of America uses slightly different data, and so its figures do not directly align with the IFPI figures listed above. But in percentage terms, the RFPI recorded a 2.3% YoY increase in total streaming revenue as of H1 2025.
Music Streaming Market Share
Over half of US music revenue comes from paid subscription services (RIAA)
Paid music streaming makes up 57.1% of all music industry revenue. Just 3% comes from digital downloads.
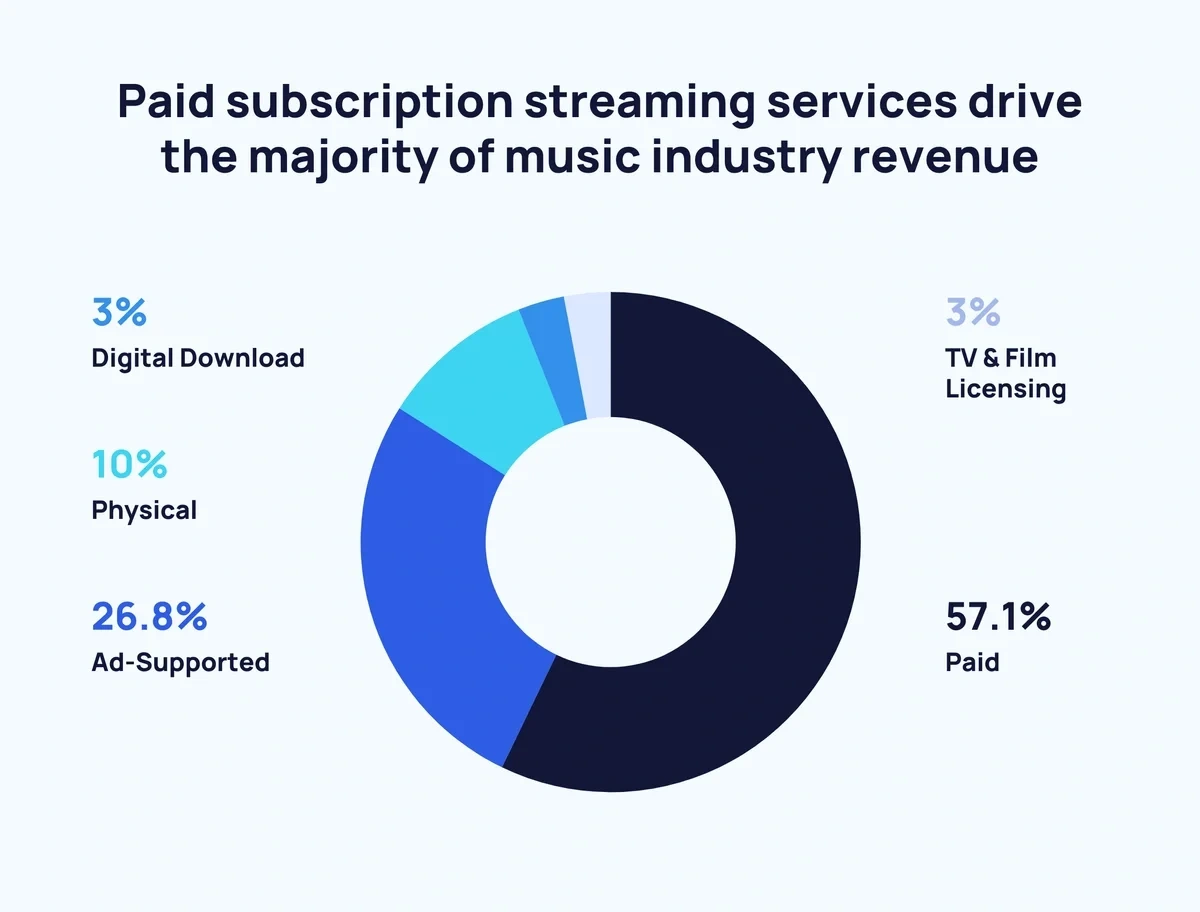
Here’s a breakdown of the most popular music sources:
| Medium | Percentage of industry revenue |
| Paid streaming | 57.1% |
| Ad-supported streaming | 26.8% |
| Physical | 10% |
| Digital download | 3% |
| TV and film rights (synch) | 3% |
Music streaming subscription revenue has grown by 9.5% in the last year (IFPI)
The Global Music Report 2025 notes that worldwide revenue from music streaming subscription services swelled by almost 10% in the last 12 months.
Radio still has a higher US listening share than streaming in the ad-supported audio vertical (Edison Research)
As of October 2025, radio made up 62% of listening time for ad-supported audio. Podcasts made up a further 20%, with 15% coming from ad-supported streaming (e.g. the Spotify Free plan).
Ad supported streaming has a higher share among listeners aged 18-34 (24%), but is still outstripped by radio (43%) and podcasts (31%).
By some calculations, music streaming revenue is predicted to hit $30 billion in 2027 (Statista)
Music streaming and digital music’s average revenue per user is expected to continue to increase over the coming years. However, figures are forecast to somewhat plateau.
(It's worth noting that the raw figures listed by Statista for recent years are higher than those reported by the RIAA or IFPI.)
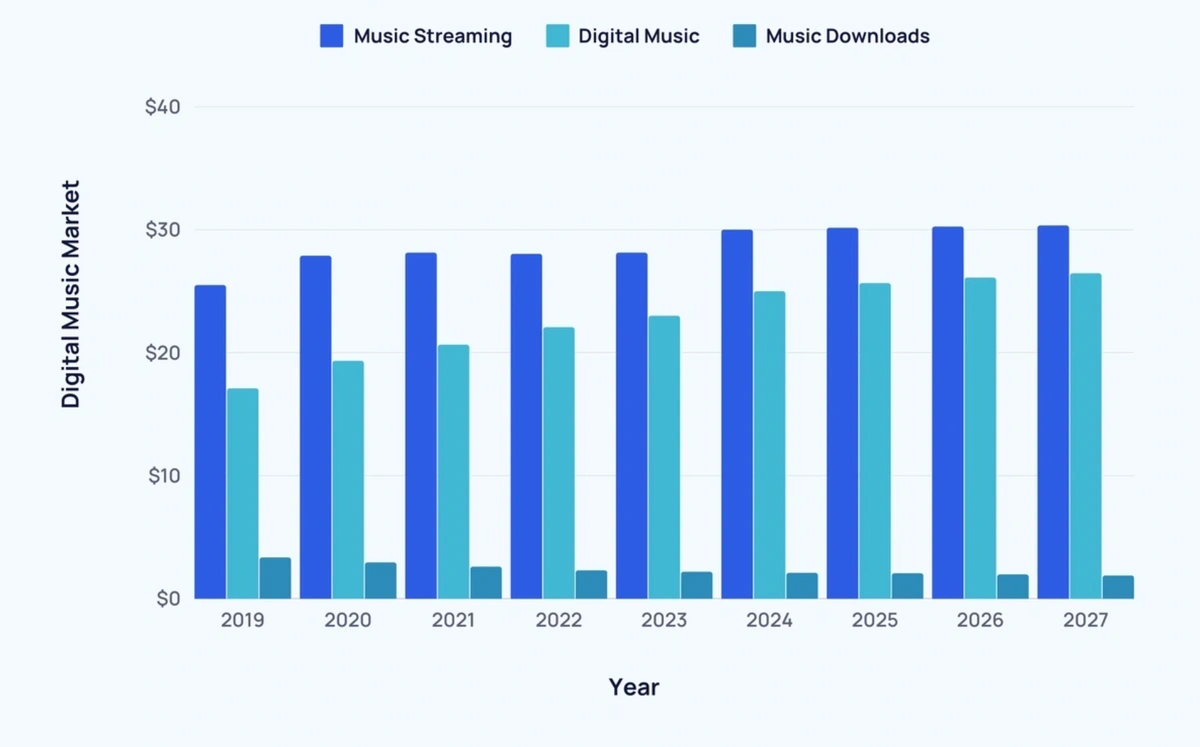
Here’s a look at the digital music market forecast, per Statista's numbers:
| Year | Music Streaming ($ billions) | Digital Music ($ billions) | Music Downloads ($ billions) |
| 2019 | $25.48 | $17.09 | $3.36 |
| 2020 | $27.87 | $19.33 | $2.96 |
| 2021 | $28.12 | $20.64 | $2.61 |
| 2022 | $28.02 | $22.06 | $2.32 |
| 2023 | $28.12 | $22.99 | $2.20 |
| 2024 | $29.99 | $24.98 | $2.11 |
| 2025 | $30.14 | $25.64 | $2.08 |
| 2026 | $30.24 | $26.10 | $1.98 |
| 2027 | $30.33 | $26.44 | $1.89 |
Music Streaming Users
Around 2 in 3 people listen to music using a streaming service (IFPI)
Approximately 67.3% listen to music using some form of music streaming service.
The number of music streaming subscribers has increased more than 12x since 2015 (IFPI, MIDiA Research, Statista)
Since Q4 2015, the number of music streaming subscribers has risen from 68 million to 818 million in Q4 2024 – an increase of over 12x.
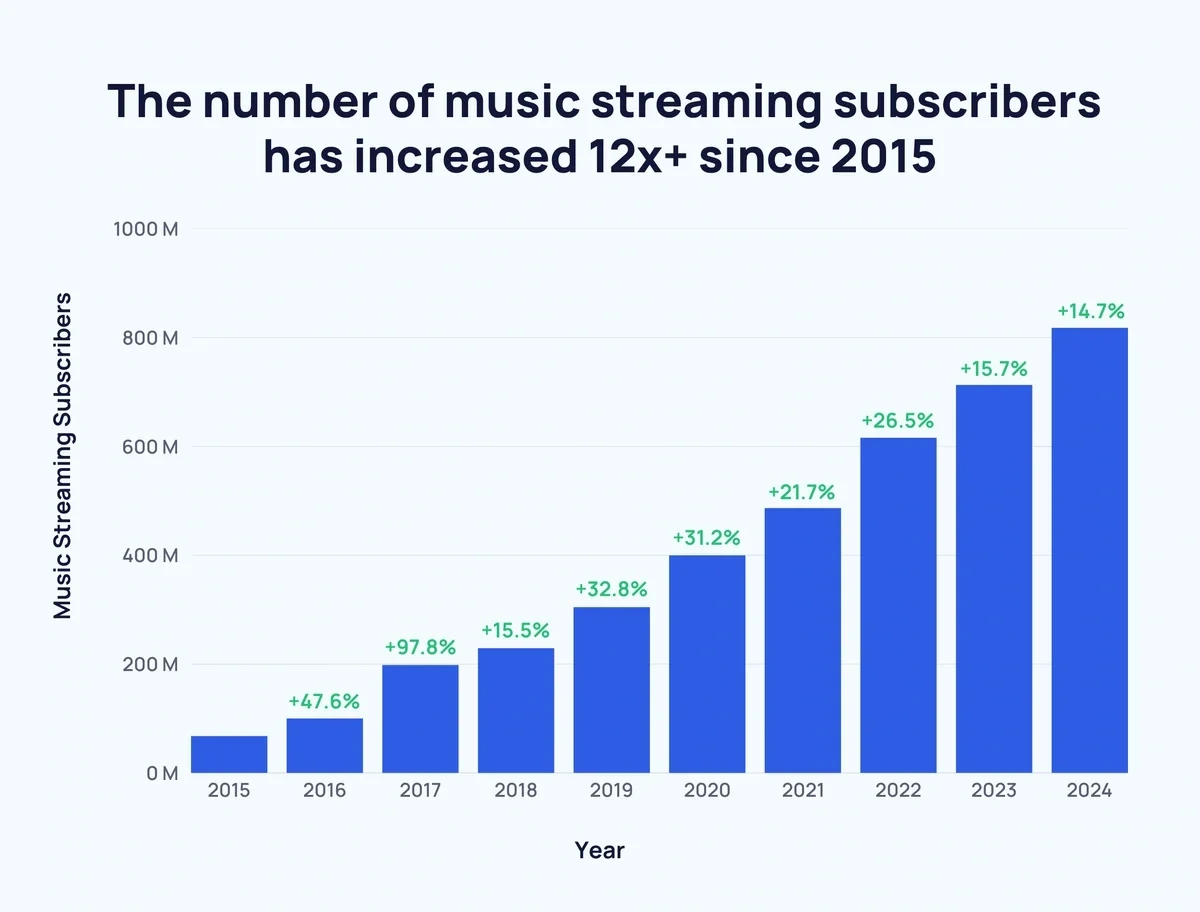
Here’s a breakdown of music streaming subscribers over time:
| Year | Music Streaming Subscribers | Increase Over Previous Year |
| Q4 2015 | 68 million | - |
| Q4 2016 | 100.4 million | +47.6% |
| Q4 2017 | 198.6 million | +97.8% |
| Q1 2018 | 229.5 million | +15.5% |
| Q1 2019 | 304.9 million | +32.8% |
| Q1 2020 | 400 million | +31.2% |
| Q1 2021 | 487 million | +21.75% |
| Q2 2022 | 616.2 million | +26.5% |
| Q3 2023 | 713 million | +15.7% |
| Q4 2024 | 818 million | +14.7% |
The UK alone streamed 210 billion audio music tracks in 2025 (Music Business Worldwide)
2025 marked the first time that the UK market crossed 200 billion annual music streams. It marked 5.5% YoY growth.
The most recent full-year global numbers are not available, but earlier figures show that the global total crossed 4.1 trillion songs in 2023.
In total, over 100 million Americans use a premium streaming service to listen to music (RIAA)
Here are the numbers for US premium music service subscribers over time:
|
Year |
US Subscribers |
Increase Over Previous Year (%) |
Increase Over Previous Period (millions) |
|
2019 |
60.4 million |
- |
- |
|
2020 |
75.5 million |
↑ 25% |
↑ 15.1 million |
|
2021 |
84 million |
↑ 11.3% |
↑ 8.5 million |
|
2022 |
91.6 million |
↑ 9% |
↑ 7.6 million |
|
2023 |
96.8 million |
↑ 5.7% |
↑ 5.2 million |
|
2025 (mid-year) |
105 million |
↑ 6.4% |
↑ 8.2 million |
Music Streaming Demographics
Around 3 in 5 of all 25 to 34-year-olds have an audio subscription service to stream music (IFPI)
62% of all 25-to-34-year-olds use audio subscription services for music listening.
And while older generations are less likely to have an audio streaming subscription, around 1 in 4 (28%) 55 to 64-year-olds do so.
Here are IFPI’s music subscription service figures by age bracket, for the most recent years these exact figures were provided:
|
Age |
Proportion 2023 |
Proportion 2022 |
|
16-24 |
60% |
54% |
|
25-34 |
62% |
56% |
|
35-44 |
50% |
44% |
|
45-54 |
40% |
36% |
|
55-64 |
28% |
26% |
Almost all Gen Z Americans use a music streaming service (SonoSuite)
Americans are among the most likely to stream music across all age brackets.
The difference across generations is often more pronounced in other countries.
For example, Americans listen to music using a streaming service in a typical week. This is compared to 98% for US Millennials, 96% for Gen X, and 89% for Boomers.
By comparison, 77% of Gen Z regularly listen to music using streaming services in the UK. And 79% of British Millennials also do so. However, the drop-off from there is far more dramatic, with only 67% of Gen Xers and 41% of Boomers using a music streaming service in a typical week.
Below, several nations’ music streaming habits are compared by generation:
| Nation | Gen Z | Millennials | Gen X | Boomers |
| Brazil | 87% | 89% | 73% | 63% |
| Mexico | 83% | 87% | 81% | 75% |
| Colombia | 84% | 88% | 76% | 69% |
| Argentina | 87% | 89% | 77% | 58% |
| Chile | 91% | 92% | 78% | 72% |
| France | 84% | 68% | 53% | 37% |
| Spain | 82% | 78% | 74% | 57% |
| UK | 77% | 79% | 67% | 41% |
| Italy | 77% | 76% | 59% | 40% |
| Germany | 83% | 78% | 59% | 37% |
| Japan | 89% | 70% | 51% | 34% |
| US | 99% | 98% | 96% | 89% |
The USA is the leading consumer of music streaming (IFPI)
According to IFPI, the US is the leading market for music streaming. But the Middle East and North Africa is the fastest growing region, with revenues swelling at 22.8% YoY.
Sub-Saharan Africa (22.6%) and Latin America (22.5%) are also fast-growing markets. And Mexico recently entered the overall top 10, overtaking Australia.
Here are the top 10 nations for music streaming:
- USA
- Japan
- UK
- Germany
- China
- France
- South Korea
- Canada
- Brazil
- Mexico
Music Streaming Preferences
Ad-free listening is the top reason for paying for a music streaming platform (IFPI)
The top three reasons for choosing to use a paid music streaming service are:
-
Ad-free listening
-
Being able to choose what music to listen to
-
Access to large libraries of songs
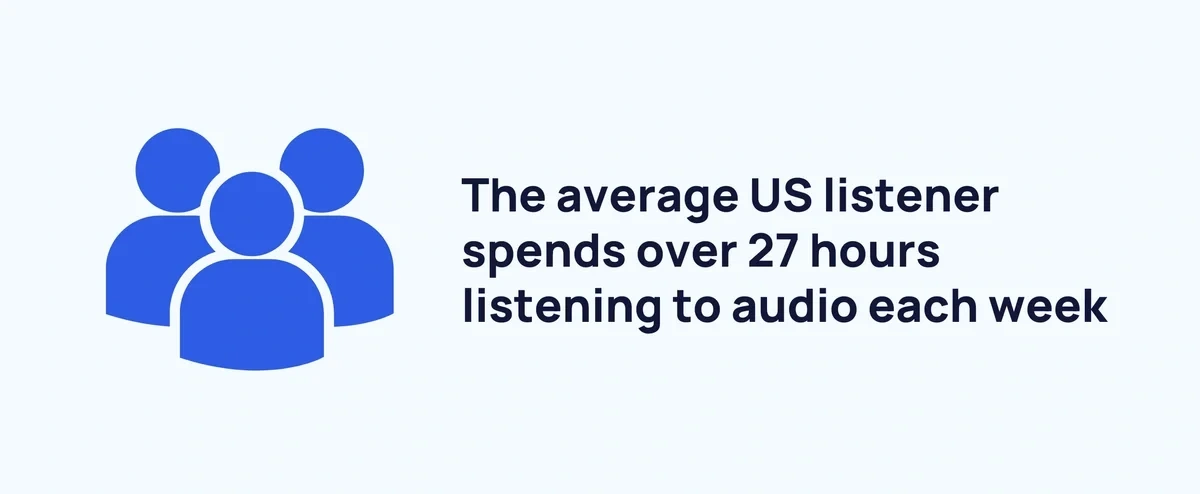
The average US listener consumes over 27 hours of audio per week (Nielsen)
As of Q3 2025, Americans listen to an average of 3 hours and 53 minutes of audio per day. That includes streaming music services, radio, and podcasts.
That equates to 27.18 hours of audio per week.
The majority of users search for a specific song to listen to (IFPI)
In general, users prefer to take control when it comes to listening habits.
In total, 63% search for a particular song to listen to more than once a week.
Over half (57%) search for a specific artist. And 59% primarily listen to their own playlists.
Music Streaming Players
Over 150,000 songs are added to music streaming platforms daily (Forbes)
Deezer alone adds around 150,000 tracks per day. A third of those are purely AI-generated.
Spotify claims over 30% of the music streaming market share (MIDiA)
Spotify currently leads the way in the music streaming market with a 31.7% share.
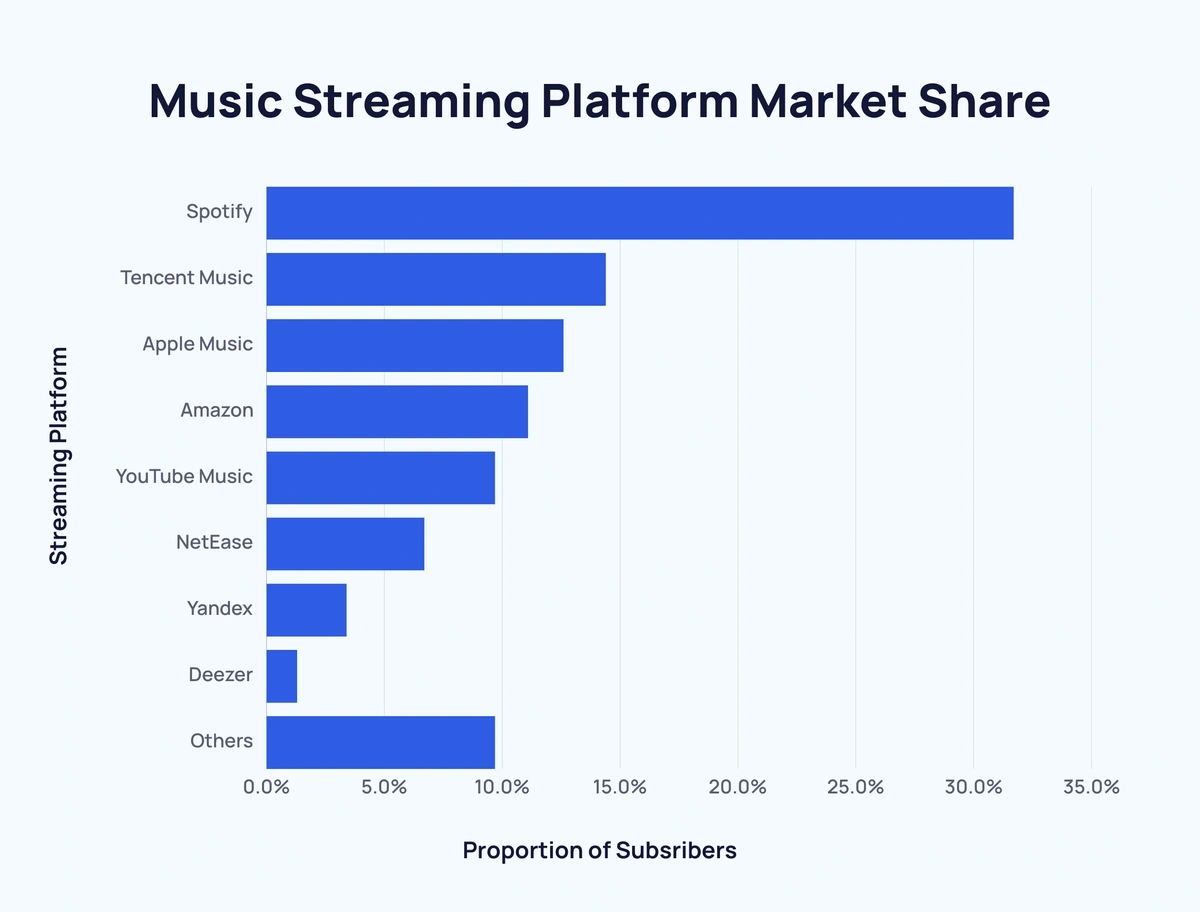
Here’s a look at the music streaming industry by market share:
|
Streaming Platform |
Proportion of Subscribers |
|
Spotify |
31.7% |
|
Tencent Music |
14.4% |
|
Apple Music |
12.6% |
|
Amazon |
11.1% |
|
YouTube Music |
9.7% |
|
NetEase |
6.7% |
|
Yandex |
3.4% |
|
Deezer |
1.3% |
|
Others |
9.7% |
The standard monthly price for a music streaming has risen above $11 (CNET)
Here’s how some of the top music streaming services compare in terms of monthly cost:
|
Streaming Service |
Monthly Cost |
|
Spotify Premium |
$12 |
|
Apple Music |
$11 |
|
Deezer |
$12 |
|
Amazon Music Unlimited |
$11 |
|
YouTube Music |
$11 |
|
QoBuz |
$13 |
Spotify Premium has 281 million subscribers (Backlinko, Spotify)
Spotify has increased its number of premium subscribers every quarter since 2015.
As of Q3 2025, there are approximately 281 million Spotify premium subscribers.

That means that with a total of 713 million monthly active users, around 39.4% of users choose to subscribe to Spotify Premium.
Here’s how the number of Spotify Premium subscribers has changed over time:
| Quarter | Spotify Premium Subscribers |
| Q1 2015 | 18 million |
| Q2 2015 | 22 million |
| Q3 2015 | 24 million |
| Q4 2015 | 28 million |
| Q1 2016 | 30 million |
| Q2 2016 | 36 million |
| Q3 2016 | 40 million |
| Q4 2016 | 48 million |
| Q1 2017 | 52 million |
| Q2 2017 | 59 million |
| Q3 2017 | 62 million |
| Q4 2017 | 71 million |
| Q1 2018 | 75 million |
| Q2 2018 | 83 million |
| Q3 2018 | 87 million |
| Q4 2018 | 96 million |
| Q1 2019 | 100 million |
| Q2 2019 | 108 million |
| Q3 2019 | 113 million |
| Q4 2019 | 124 million |
| Q1 2020 | 130 million |
| Q2 2020 | 138 million |
| Q3 2020 | 144 million |
| Q4 2020 | 155 million |
| Q1 2021 | 158 million |
| Q2 2021 | 165 million |
| Q3 2021 | 172 million |
| Q4 2021 | 180 million |
| Q1 2022 | 182 million |
| Q2 2022 | 188 million |
| Q3 2022 | 195 million |
| Q4 2022 | 205 million |
| Q1 2023 | 210 million |
| Q2 2023 | 220 million |
| Q3 2023 | 226 million |
| Q4 2023 | 236 million |
| Q1 2024 | 239 million |
| Q2 2024 | 246 million |
| Q3 2024 | 252 million |
| Q4 2024 | 263 million |
| Q1 2025 | 268 million |
| Q2 2025 | 278 million |
| Q3 2025 | 281 million |
Spotify has more than double Apple Music’s paid subscribers (various public sources)
Here’s a comparison between some of the biggest music streaming platforms by number of paid subscribers:
|
Subscribers |
||||||
|
Year |
Spotify |
Tencent Music |
YouTube Music |
Apple Music |
Amazon Music |
NetEase Music |
|
2016 |
36 million |
- |
3 million |
20 million |
- |
- |
|
2017 |
59 million |
- |
2.8 million |
27 million |
- |
- |
|
2018 |
83 million |
23.3 million |
10 million |
40 million |
16 million |
- |
|
2019 |
108 million |
31 million |
18 million |
50 million |
32 million |
6.7 million |
|
2020 |
138 million |
47.1 million |
30 million |
72 million |
55 million |
16 million |
|
2021 |
165 million |
60.9 million |
50 million |
80 million |
63 million |
26.1 million |
|
2022 |
188 million |
82.7 million |
80 million |
88 million |
74 million |
37.6 million |
|
2023 |
220 million |
106.7 million |
100 million |
93 million |
80 million |
44.1 million |
|
2025 |
281 million |
125.7 million |
125 million |
94 million |
80 million |
50 million |
Most Popular Streamed Music
2025’s most popular song garnered approximately 1.5 billion streams on Spotify (Kworb)
Ordinary by Alex Warren was the most popular song on Spotify in 2025. The song accumulated around 1.5 billion streams, which was actually slightly lower than the top hits of the last 3 years.
Here’s a breakdown of the most popular songs by number of streams over time:
| Year | Song | Artist | Streams |
| 2018 | God’s Plan | Drake | 917.9 million |
| 2019 | Old Town Road | Lil Nas X | 1 billion |
| 2020 | The Box | Roddy Ricch | 920.4 million |
| 2021 | Levitating | Dua Lipa | 626.6 million |
| 2022 | As It Was | Harry Styles | 1.5 billion |
| 2023 | Flowers | Miley Cyrus | 1.6 billion |
| 2024 | Die With a Smile | Lady Gaga and Bruno Mars | 1.7 billion |
| 2025 | Ordinary | Alex Warren | 1.48 billion |
Drake was the most-streamed artist of the 2010s with over 36 billion streams (chart data)
Across the 2010s, the most-streamed artists racked up 10s of billions of streams.
Here are the most successful artists of the 2010s in terms of streams:
| Rank | Artist | Streams |
| 1 | Drake | 36.3 billion |
| 2 | Post Malone | 18.9 billion |
| 3 | Eminem | 17.8 billion |
| 4 | Ariana Grande | 13.9 billion |
| 5 | Future | 13.9 billion |
| 6 | The Weeknd | 13.6 billion |
| 7 | Taylor Swift | 13.3 billion |
| 8 | XXXTentacion | 13 billion |
| 9 | Ed Sheeran | 12.9 billion |
| 10 | Rihanna | 12.8 billion |
R&B/hip-hop is the most popular music genre in the US (Nielsen)
Almost 1 in 3 (29.9%) of songs streamed in the US fall into these genres - that’s almost 2x more than second-placed rock (17%).
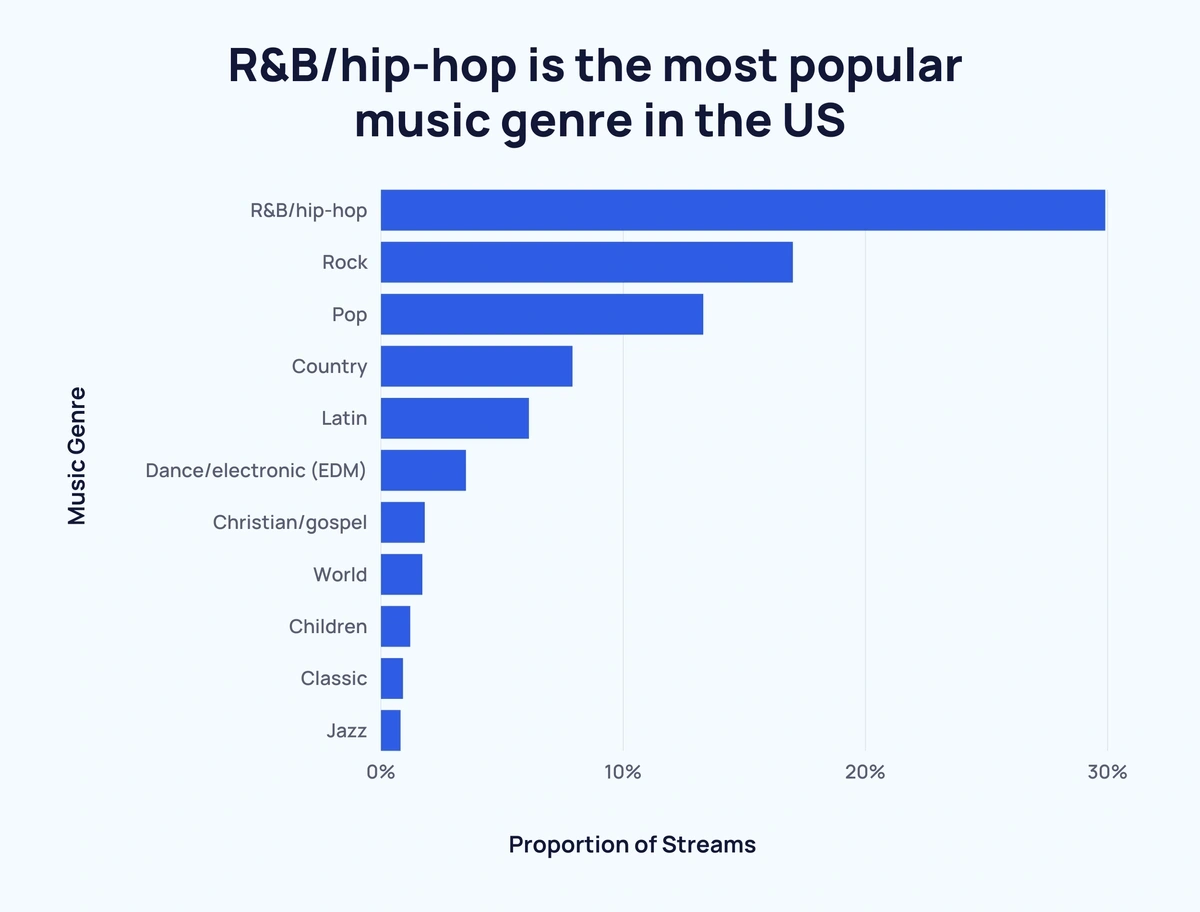
Here’s a full breakdown of the most popular music genres in the US:
| Music Genre | Proportion of Streams |
| R&B/hip-hop | 29.9% |
| Rock | 17% |
| Pop | 13.3% |
| Country | 7.9% |
| Latin | 6.1% |
| Dance/electronic (EDM) | 3.5% |
| Christian/gospel | 1.8% |
| World | 1.7% |
| Children | 1.2% |
| Classic | 0.9% |
| Jazz | 0.8% |
Only 0.5% of all legitimate streams go to purely AI-generated tracks (Forbes)
In 2026, AI's increasingly impressive capabilities have made their way to the world of music. But the appeal of purely AI-generated tracks remains low.
On Deezer, only 0.5% of legitimate streams go to AI songs. These tracks also account for 70% of the streams detected as fraudulent.
At current rates, pure AI tracks submitted to music streaming services will outnumber human-created tracks by the middle of 2026 (Forbes)
All of the major music streaming services have announced steps to try and combat fraudulent or "spammy" AI-created tracks designed to artificially generate royalties.
Key Takeaways
It’s clear that music streaming continues to go from strength to strength, even if the era of AI is bringing new challenges in 2026.
And the industry is as reliant as ever on streaming services.
For more related content, have a look at Huge Streaming Trends and Video Streaming Services Stats.