Americans spend a lot of money over the holidays.
In fact, annual holiday shopping budgets appear to be on the rise. But how much do Americans spend on Christmas each year?
In this article, we'll do a deep dive into the latest data, covering each of these subcategories:
- Key American Christmas Spending Stats
- Average Christmas Spending
- US Christmas Gift Spending Over Time
- US Christmas Non-Gift Spending Over Time
- Average Christmas Spending Around The World
- US Christmas Spend By Demographic
- Holiday Gift Type By Demographic
- US Holiday Shopping Preferences
Key American Christmas Spending Stats
The headline from 2024 is that retail sales grew 3.8% year-over-year during the latest holiday season. (That excludes automotive sales, to give a better reflection of spending that is holiday-related.)
Jewelry was a particular growth vertical, with sales up 4%. Electronics and apparel also saw notable rises.
And E-commerce growth streaked ahead of physical commerce. Online sales rose 6.7%, compared to 2.9% for in-store purchases.
Here are some highlights:
- Americans spend over $900 on Christmas each year.
- 71% of US holiday budgets are assigned to gift purchases.
- US holiday sales have grown year-over-year for over a decade.
- 96% of Americans buy gifts for their families.
- Deloitte estimates that Americans spend over $500 a year on non-gift items.
- Canadians spend nearly $1,000 more than Americans during the holidays.
- On average, men spend 10% more than women on holiday purchases.
- The highest-spending Americans over the winter holidays are aged 45-54.
- The Northeast outspends the South by around $100 per person each year.
- Gift cards are the most popular present to receive.
- 48% of Americans begin Christmas shopping before the end of October.
- More than half (63%) of Americans shop online for holiday purchases.
Average Christmas Spending Data
Christmas is a major expenditure for many Americans. According to the latest data from the National Retail Federation (NRF), Americans spend an average of $902 each Christmas.

That’s close to the median pre-tax weekly salary of $1,165. In other words, the average American spends about a week’s salary on Christmas gifts annually.
Here’s how that $902 is spent:
| Purchase Type | Average Projected Spend (2024) | Percentage of Total Spend |
| Gifts for Family, Friends, and Coworkers | $641 | 71% |
| Other Seasonal Items | $261 | 29% |
| Total | $902 | - |
The data shows that over two-thirds of the average American’s holiday budget goes toward gifts. The rest is spent on decorations and non-gift purchases (ie, travel expenses).
Sources: National Retail Federation, BLS
US Christmas Gift Spending Over Time
The NRF reports that US holiday season retail sales have increased year-over-year since 2008.
2024's holiday season sales totaled approximately $994.1 billion. That’s more than double 2004’s figure of $467.2 billion.
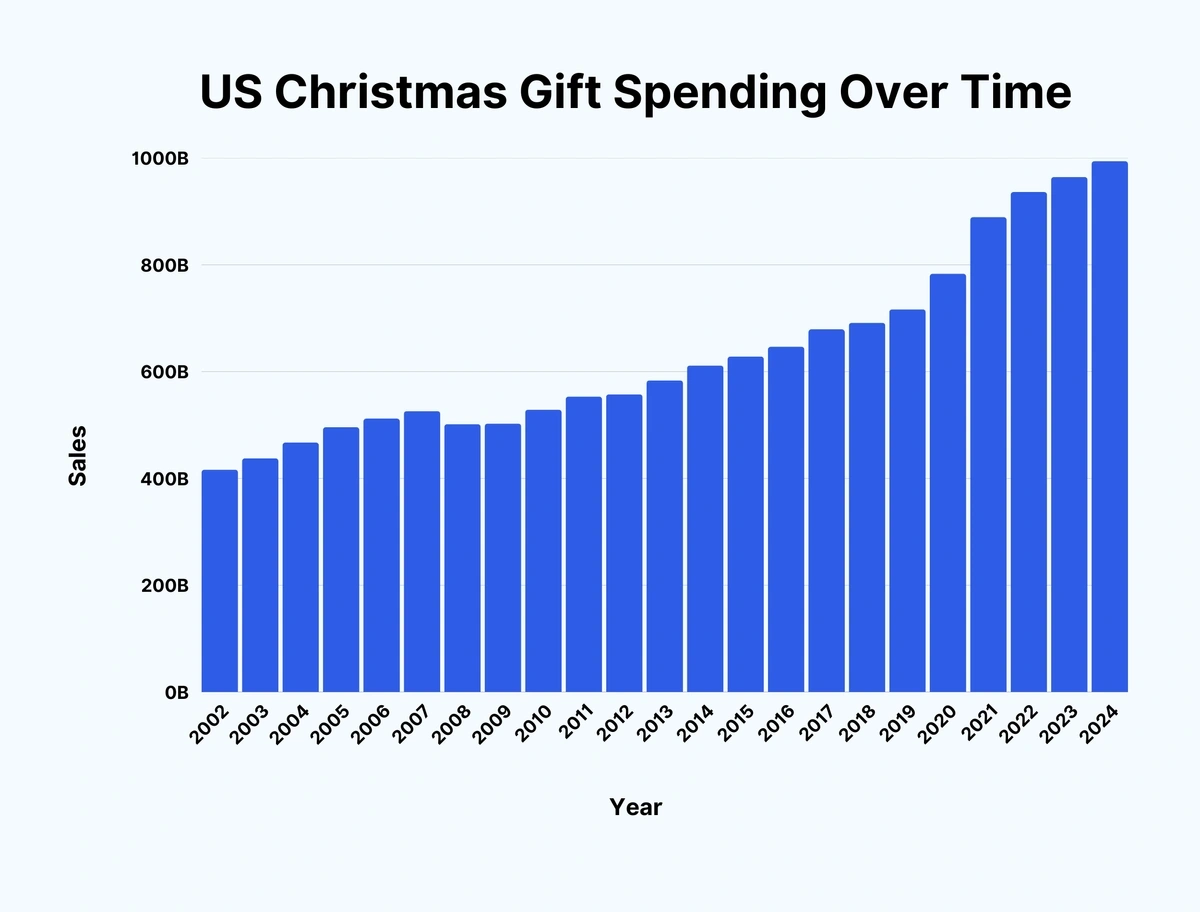
Here’s a more detailed look at US holiday sales over time:
| Year | Sales | Sales Change Over Previous Year | Percentage Change Over Previous Year |
| 2002 | $416.4 billion | - | ↑ 2.1% |
| 2003 | $437.6 billion | ↑ $21.2 billion | ↑ 5.1% |
| 2004 | $467.2 billion | ↑ $29.6 billion | ↑ 6.8% |
| 2005 | $496 billion | ↑ $28.8 billion | ↑ 6.2% |
| 2006 | $512.1 billion | ↑ $16.1 billion | ↑ 3.2% |
| 2007 | $526 billion | ↑ $13.9 billion | ↑ 2.7% |
| 2008 | $501.5 billion | ↓ $24.5 billion | ↓ 4.7% |
| 2009 | $502.7 billion | ↑ $1.2 billion | ↑ 0.2% |
| 2010 | $528.8 billion | ↑ $26.1 billion | ↑ 5.2% |
| 2011 | $553.3 billion | ↑ $24.5 billion | ↑ 4.6% |
| 2012 | $557.6 billion | ↑ $4.3 billion | ↑ 2.6% |
| 2013 | $583.5 billion | ↑ $25.9 billion | ↑ 2.8% |
| 2014 | $611.5 billion | ↑ $28 billion | ↑ 4.8% |
| 2015 | $628.2 billion | ↑ $16.7 billion | ↑ 2.7% |
| 2016 | $646.7 billion | ↑ $18.5 billion | ↑ 3.0% |
| 2017 | $679.2 billion | ↑ $32.5 billion | ↑ 5.0% |
| 2018 | $691.5 billion | ↑ $12.3 billion | ↑ 1.8% |
| 2019 | $716.7 billion | ↑ $25.3 billion | ↑ 3.6% |
| 2020 | $783.4 billion | ↑ $64.4 billion | ↑ 9.3% |
| 2021 | $889.3 billion | ↑ $112 billion | ↑ 13.5% |
| 2022 | $936.3 billion | ↑ $47 billion | ↑ 5.3% |
| 2023 | $964.4 billion | ↑ $28.1 billion | ↑ 3.8% |
| 2024 | $994.1 billion | ↑ $29.7 billion | ↑ 3.1% |
Despite consistent annual holiday spending increases, gift spending hasn’t increased in every category.
The amount spent on gifts for family members has increased year-over-year from $389 in 2008 to $514 in 2021.
Yet, average spending on gifts for friends, coworkers, and other gifts has remained relatively stagnant.
Below is a breakdown of average holiday spending over time by gift recipient:
| Year | Gifts for Family | Gifts for Friends | Gifts for Coworkers | Other Gifts | ||||
| Spend | Change | Spend | Change | Spend | Change | Spend | Change | |
| 2004 | $405 | - | $71 | - | $22 | - | $41 | - |
| 2005 | $419 | ↑ $14 | $79 | ↑ $8 | $21 | ↓ $1 | $44 | ↑ $3 |
| 2006 | $428 | ↑ $9 | $81 | ↑ $2 | $21 | - $0 | $42 | ↓ $2 |
| 2007 | $434 | ↑ $6 | $83 | ↑ $2 | $21 | - $0 | $35 | ↓ $7 |
| 2008 | $389 | ↓ $65 | $79 | ↓ $4 | $22 | ↑ $1 | $36 | ↑ $1 |
| 2009 | $387 | ↓ $2 | $67 | ↓ $12 | $19 | ↓ $3 | $35 | ↓ $1 |
| 2010 | $411 | ↑ $24 | $75 | ↑ $8 | $19 | - $0 | $36 | ↑ $1 |
| 2011 | $424 | ↑ $13 | $72 | ↓ $3 | $22 | ↑ $3 | $25 | ↓ $11 |
| 2012 | $423 | ↓ $1 | $75 | ↑ $3 | $24 | ↑ $2 | $28 | ↑ $3 |
| 2013 | $432 | ↑ $9 | $75 | - $0 | $25 | ↑ $1 | $27 | ↓ $1 |
| 2014 | $459 | ↑ $17 | $80 | ↑ $5 | $26 | ↑ $1 | $30 | ↑ $3 |
| 2015 | $471 | ↑ $12 | $79 | ↓ $1 | $26 | - $0 | $29 | ↓ $1 |
| 2016 | $486 | ↑ $15 | $81 | ↑ $2 | $26 | - $0 | $28 | ↓ $1 |
| 2017 | $478 | ↓ $8 | $75 | ↓ $6 | $25 | ↓ $1 | $29 | ↑ $1 |
| 2018 | $506 | ↑ $28 | $75 | - $0 | $26 | ↑ $1 | $31 | ↑ $2 |
| 2019 | $501 | ↓ $5 | $84 | ↑ $9 | $35 | ↑ $9 | $38 | ↑ $7 |
| 2020 | $502 | ↑ $1 | $80 | ↓ $5 | $32 | ↓ $3 | $36 | ↓ $2 |
| 2021 | $514 | ↑ $12 | $79 | ↓ $1 | $25 | ↓ $7 | $30 | ↓ $6 |
And here’s a look at what percentage of Americans bought for those recipients during the same period:
| Year | Gifts for Family | Gifts for Friends | Gifts for Coworkers | Other Gifts | ||||
| % | Change | % | Change | % | Change | % | Change | |
| 2004 | 98% | - | 80% | - | 39% | - | 50% | - |
| 2005 | 98% | - 0% | 81% | ↑ 1% | 38% | ↓ 1% | 48% | ↓ 2% |
| 2006 | 98% | - 0% | 83% | ↑ 2% | 40% | ↑ 2% | 52% | ↑ 4% |
| 2007 | 98% | - 0% | 80% | ↓ 3% | 37% | ↓ 3% | 47% | ↓ 5% |
| 2008 | 98% | - 0% | 80% | - 0% | 41% | ↑ 4% | 49% | ↑ 2% |
| 2009 | 98% | - 0% | 75% | ↓ 5% | 33% | ↓ 8% | 42% | ↓ 7% |
| 2010 | 97% | ↓ 1% | 74% | ↓ 1% | 32% | ↓ 1% | 45% | ↑ 3% |
| 2011 | 97% | - 0% | 74% | - 0% | 32% | - 0% | 44% | ↓ 1% |
| 2012 | 97% | - 0% | 72% | ↓ 2% | 32% | - 0% | 44% | - 0% |
| 2013 | 96% | ↓ 1% | 71% | ↓ 1% | 31% | ↓ 1% | 42% | ↓ 2% |
| 2014 | 97% | ↑ 1% | 73% | ↑ 2% | 35% | ↑ 4% | 44% | ↑ 2% |
| 2015 | 96% | ↓ 1% | 71% | ↓ 2% | 33% | ↓ 2% | 43% | ↓ 1% |
| 2016 | 97% | ↑ 1% | 71% | - 0% | 33% | - 0% | 43% | - 0% |
| 2017 | 97% | - 0% | 70% | ↓ 1% | 33% | - 0% | 44% | ↑ 1% |
| 2018 | 97% | - 0% | 70% | - 0% | 33% | - 0% | 42% | ↓ 2% |
| 2019 | 96% | ↓ 1% | 70% | - 0% | 34% | ↑ 1% | 42% | - 0% |
| 2020 | 96% | - 0% | 67% | ↓ 3% | 31% | ↓ 3% | 41% | ↓ 1% |
| 2021 | 96% | - 0% | 68% | ↑ 1% | 30% | ↓ 1% | 41% | - 0% |
The proportion of Americans purchasing gifts for family has remained largely unchanged over the last 15 years or so.
However, the number of people purchasing holiday gifts for friends is down 12% since 2004. And it is 15% lower than the 15-year peak of 83% in 2006.
While people purchasing for coworkers has dropped from 39% (41% high in 2008) to 30% in 2021.
And other gift purchases are being made by just 41% of Americans - down from 50% in 2004 and 52% in 2006.
The total spent on gifts for family dropped by $65 following the 2008 global financial crisis. This appeared to have a knock-on effect in 2009 for gift recipients.
That year saw the proportion of Americans buying:
- Gifts for friends dropped 5%
- Gifts for coworkers dropped 7%
- Other gifts dropped 8%
According to recent data, Americans overestimate their Christmas gift spending by over $100.
A 2024 survey revealed that US citizens expected to spend an average of $1,012 on Christmas shopping. That’s $110 more than the average spent during that holiday season.
Unsurprisingly, the lowest expected Christmas gift spending of the 21st century came in 2008 ($616) and 2009 ($638).
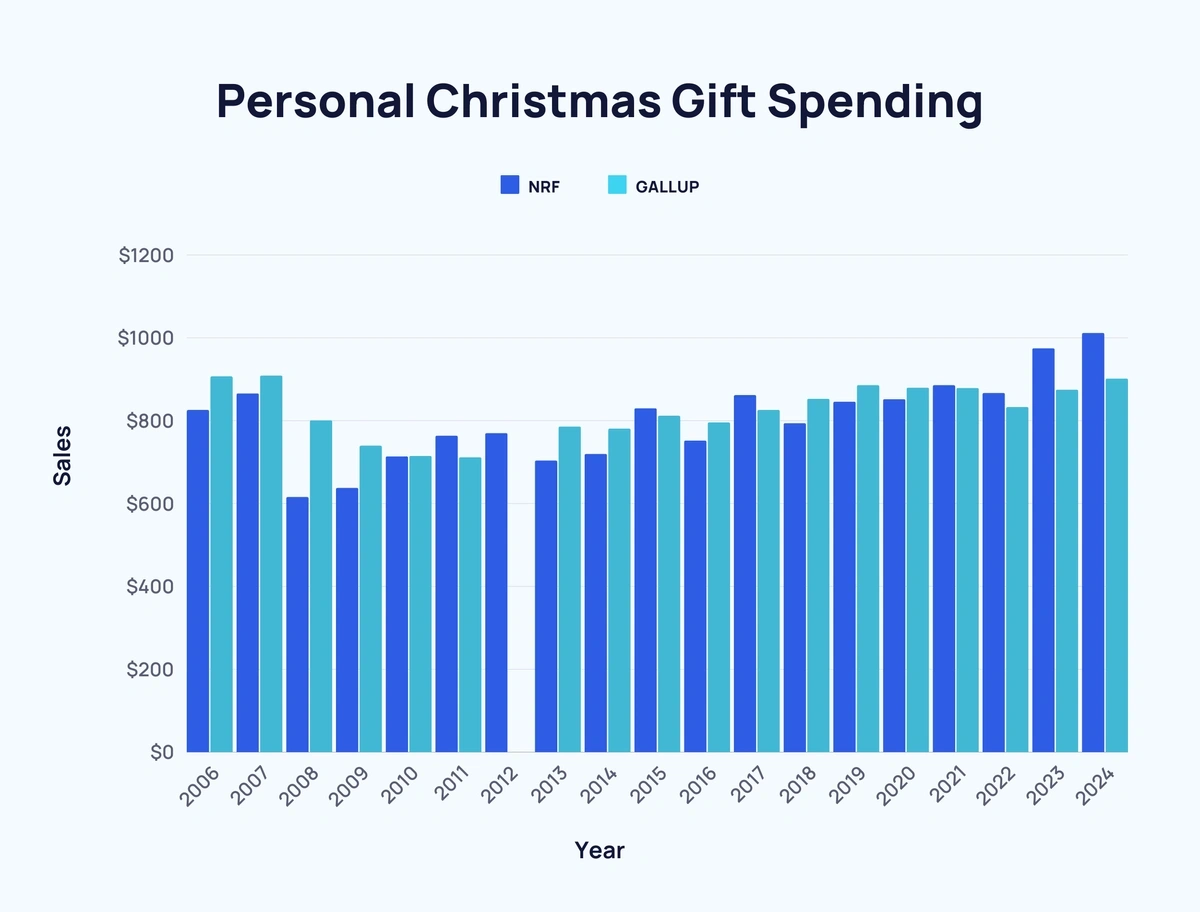
Here’s a closer look at the figures:
| Year | Personal Christmas Gift Spending Estimate (Gallup) | Personal Christmas Gift Spending (NRF) |
| 2006 | $826 | $907 |
| 2007 | $866 | $909 |
| 2008 | $616 | $801 |
| 2009 | $638 | $740 |
| 2010 | $714 | $715 |
| 2011 | $764 | $712 |
| 2012 | $770 | - |
| 2013 | $704 | $786 |
| 2014 | $720 | $781 |
| 2015 | $830 | $812 |
| 2016 | $752 | $796 |
| 2017 | $862 | $826 |
| 2018 | $794 | $853 |
| 2019 | $846 | $886 |
| 2020 | $852 | $880 |
| 2021 | $886 | $879 |
| 2022 | $867 | $833 |
| 2023 | $975 | $875 |
| 2024 | $1,012 | $902 |
NRF's 2024 Christmas spending projection of $902 is the highest in over a decade.
Similarly, Gallup's 2024 figure of $1,012 is a new record.
Sources: National Retail Federation, Gallup
US Christmas Non-Gift Spending Over Time
Christmas spending isn’t solely limited to gifts. Americans spend an average of $507 on non-gift Christmas expenses each year.

In fact, non-gift spending has been on the rise for years, as have experiences, which total an estimated $735 in 2024.
This is how those totals have evolved since 2019:
| Year | Gifts | Non-Gifts | Experiences | Total | ||||
| Spend | Change | Spend | Change | Spend | Change | Spend | Change | |
| 2019 | $511 | - | $389 | - | $596 | - | $1,496 | - |
| 2020 | $487 | ↓ 4.7% | $435 | ↑ 11.8% | $465 | ↓ 22% | $1,387 | ↓ 7.3% |
| 2021 | $501 | ↑ 2.9% | $425 | ↓ 2.3% | $536 | ↑ 15.3% | $1,463 | ↑ 5.5% |
| 2022 | $507 | ↑ 1.2% | $373 | ↓ 12.2% | $576 | ↑ 7.5% | $1,455 | ↓ 0.5% |
| 2023 | $554 | ↑ 9.3% | $466 | ↑ 24.9% | $632 | ↑ 9.7% | $1,652 | ↑ 13.5% |
| 2024 | $536 | ↓ 3.2% | $507 | ↑ 8.8% | $735 | ↑ 16.3% | $1,778 | ↑ 7.6% |
Since 2019 ($389), the average spend on non-gifts during the Christmas period has increased by $118.
Source: Deloitte
Average Christmas Spending Around the World
According to WorldRemit data, the average Christmas sees Americans spend $1,205 per year.
Yet, that isn’t the world’s highest spender. In fact, Canadians spend over $500 more ($1,717 each year).
Having said this, of 24 selected countries, the US sees the second-highest proportion of Christmas money spent on gifts (69%), trailing only the UK (70%). By contrast, just 10% of the Dominican Republic’s holiday spending goes toward gifts.
Filipinos spend 60% of their Christmas money on food. Whereas Colombians spend just 10%, similar to the US's 12%.
Americans spend just 19% of their holiday budget on decorations. Of the measured countries, the Philippines (7%) devotes the smallest proportion of its festive budget towards decorations. On the other end of the spectrum, Dominicans put 80% of their Christmas funds toward festive decor.
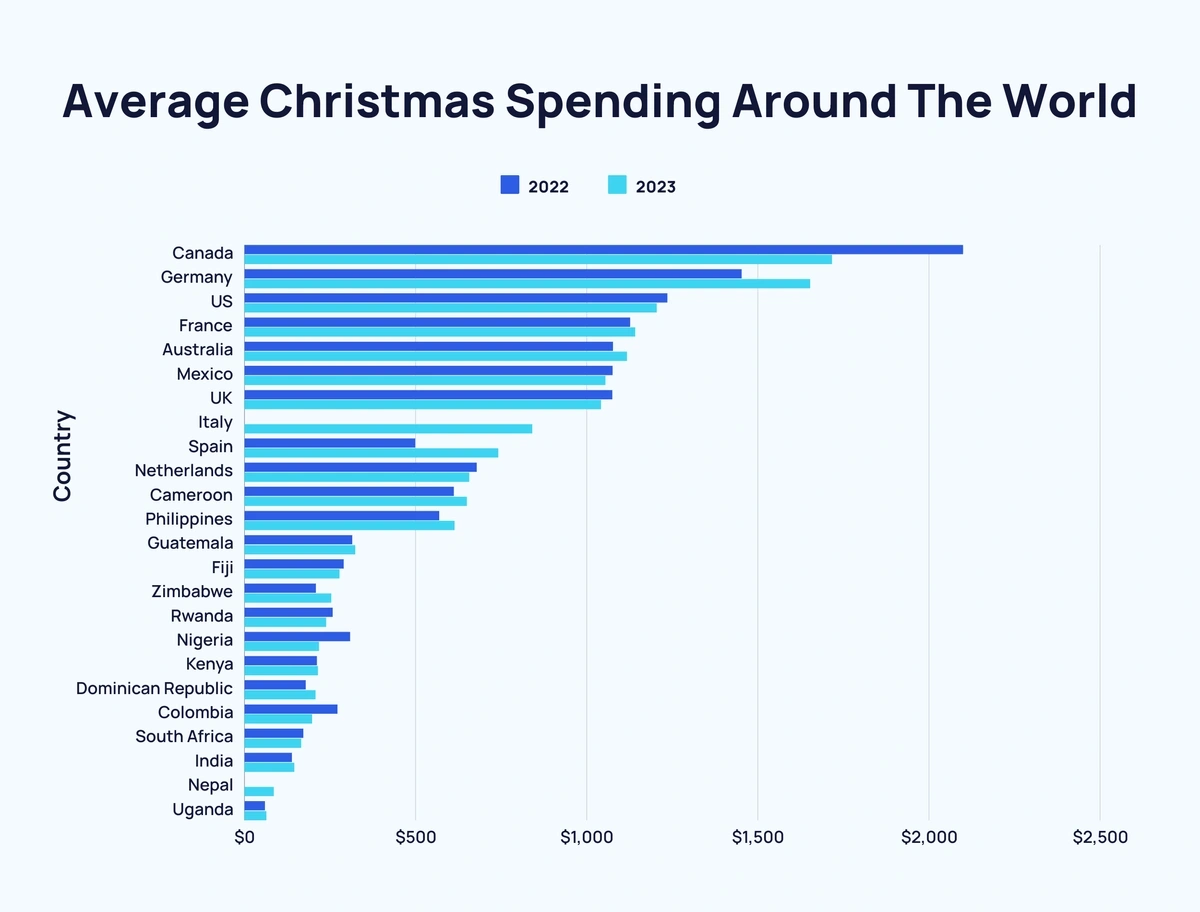
Here’s a full breakdown of the data from 24 selected countries ranked by average total spending:
| Rank | Country | Average Total Spent 2022 | Average Total Spent 2023 | Change Over Previous Year | Food | Decorations | Gifts | |||
| $ | % | $ | % | $ | % | |||||
| 1 | Canada | $2,100 | $1,717 | ↓ 18.2% | $395 | 23% | 445% | 26% | $946 | 55% |
| 2 | Germany | $1,453 | $1,653 | ↑ 13.8% | $276 | 17% | $275 | 17% | - | - |
| 3 | US | $1,236 | $1,205 | ↓ 2.5% | $147 | 12% | $231 | 19% | $826 | 69% |
| 4 | France | $1,127 | $1,142 | ↑ 1.3% | $124 | 11% | $269 | 24% | $749 | 66% |
| 5 | Australia | $1,077 | $1,118 | ↑ 3.8% | $380 | 32% | $284 | 24% | $524 | 44% |
| 6 | Mexico | $1,076 | $1,055 | ↓ 2% | $167 | 16% | $343 | 33% | $544 | 52% |
| 7 | UK | $1,075 | $1,042 | ↓ 3.1% | $121 | 12% | $193 | 19% | $728 | 70% |
| 8 | Italy | - | $841 | - | $169 | 20% | $243 | 29% | $430 | 51% |
| 9 | Spain | $499 | $742 | ↑ 48.7% | $284 | 38% | $109 | 15% | $349 | 47% |
| 10 | Netherlands | $679 | $657 | ↓ 3.2% | $194 | 30% | $136 | 21% | $327 | 50% |
| 11 | Cameroon | $612 | $650 | ↑ 6.2% | $220 | 34% | $333 | 51% | $96 | 15% |
| 12 | Philippines | $569 | $614 | ↑ 7.9% | $366 | 60% | $42 | 7% | $205 | 33% |
| 13 | Guatemala | $315 | $324 | ↑ 2.9% | $36 | 11% | $209 | 64% | $80 | 25% |
| 14 | Fiji | $290 | $278 | ↓ 4.1% | $36 | 13% | $163 | 59% | $79 | 28% |
| 15 | Zimbabwe | $209 | $254 | ↑ 21.5% | $55 | 22% | $94 | 37% | $105 | 41% |
| 16 | Rwanda | $258 | $239 | ↓ 7.4% | $78 | 32% | $80 | 34% | $81 | 34% |
| 17 | Nigeria | $309 | $218 | ↓ 29.4% | $114 | 52% | $68 | 31% | $36 | 17% |
| 18 | Kenya | $212 | $215 | ↑ 1.4% | $46 | 21% | $49 | 23% | $120 | 56% |
| 19 | Dominican Republic | $179 | $208 | ↑ 16.2% | $22 | 11% | $167 | 80% | $20 | 10% |
| 20 | Colombia | $272 | $198 | ↓ 27.2% | $19 | 10% | $97 | 49% | $82 | 41% |
| 21 | South Africa | $172 | $166 | ↓ 3.5% | $43 | 26% | $59 | 36% | $63 | 38% |
| 22 | India | $139 | $146 | ↑ 5% | $58 | 40% | $40 | 27% | $48 | 33% |
| 23 | Nepal | - | $86 | - | $43 | 50% | $20 | 23% | $23 | 26% |
| 24 | Uganda | $60 | $64 | ↑ 6.7% | $36 | 56% | $13 | 20% | $15 | 23% |
And here is how much each country spends on Christmas as a percentage of average household income:
| Rank | Country | Average Household Income | Average Total Spent | Percentage of Average Household Income Spent |
| 1 | Cameroon | $8,830 | $650 | 7.4% |
| 2 | Philippines | $9,430 | $614 | 6.5% |
| 3 | Dominican Republic | $4,206 | $208 | 4.9% |
| 4 | Mexico | $22,106 | $1,055 | 4.8% |
| 5 | Nigeria | $5,288 | $218 | 4.1% |
| =6 | Canada | $49,446 | $1,717 | 3.5% |
| =6 | Zimbabwe | $7,212 | $254 | 3.5% |
| =6 | Rwanda | $6,810 | $239 | 3.5% |
| 9 | Germany | $58,853 | $1,653 | 2.8% |
| 10 | France | $52,686 | $1,142 | 2.2% |
| 11 | Guatemala | $16,307 | $324 | 2% |
| =12 | Australia | $59,973 | $1,118 | 1.9% |
| =12 | UK | $53,901 | $1,042 | 1.9% |
| =12 | Italy | $44,827 | $841 | 1.9% |
| 15 | Kenya | $11,651 | $215 | 1.8% |
| 16 | Spain | $42,796 | $742 | 1.7% |
| 17 | US | $77,463 | $1,205 | 1.6% |
| 18 | Colombia | $13,560 | $198 | 1.5% |
| 19 | Nepal | $7,290 | $86 | 1.2% |
| =20 | Netherlands | $62,133 | $657 | 1.1% |
| =20 | Fiji | $25,118 | $278 | 1.1% |
| 22 | Uganda | $9,029 | $64 | 0.7% |
| =23 | South Africa | $19,950 | $166 | 0.1% |
| =23 | India | $24,887 | $146 | 0.1% |
From the available data, the US spends a relatively low proportion of household income on Christmas shopping at under 2%.
Source: WorldRemit
US Christmas Spend by Demographic
US Christmas Spend by Gender
On average, men ($1,046.38) spend almost 10% more on Christmas shopping than women ($952.03).
In terms of what the money is actually spent on, there is very little difference between men and women.
Data shows that a greater proportion of men buy gifts for coworkers (33% vs 28%). In comparison, a larger proportion of women buy candy & food (93% vs 88%).
Here are the figures in full:
| Expense | Proportion of Men | Proportion of Women | Difference |
| Gifts for family | 96% | 96% | 0% |
| Gifts for friends | 68% | 69% | 1% (W) |
| Gifts for coworkers | 33% | 28% | 5% (M) |
| Other gifts | 42% | 40% | 2% (M) |
| Decorations | 68% | 70% | 2% (W) |
| Greeting cards and postage | 69% | 68% | 1% (M) |
| Candy and food | 89% | 93% | 4% (W) |
| Flowers | 47% | 45% | 2% (M) |
| Non-gift | 48% | 47% | 1% (M) |
US Christmas Spend by Age
Breaking things down by age, the 45-54 years age group spends the most, averaging a figure of $1,161.98.
At almost half that total, 18-24-year-olds spend the least ($649.81).
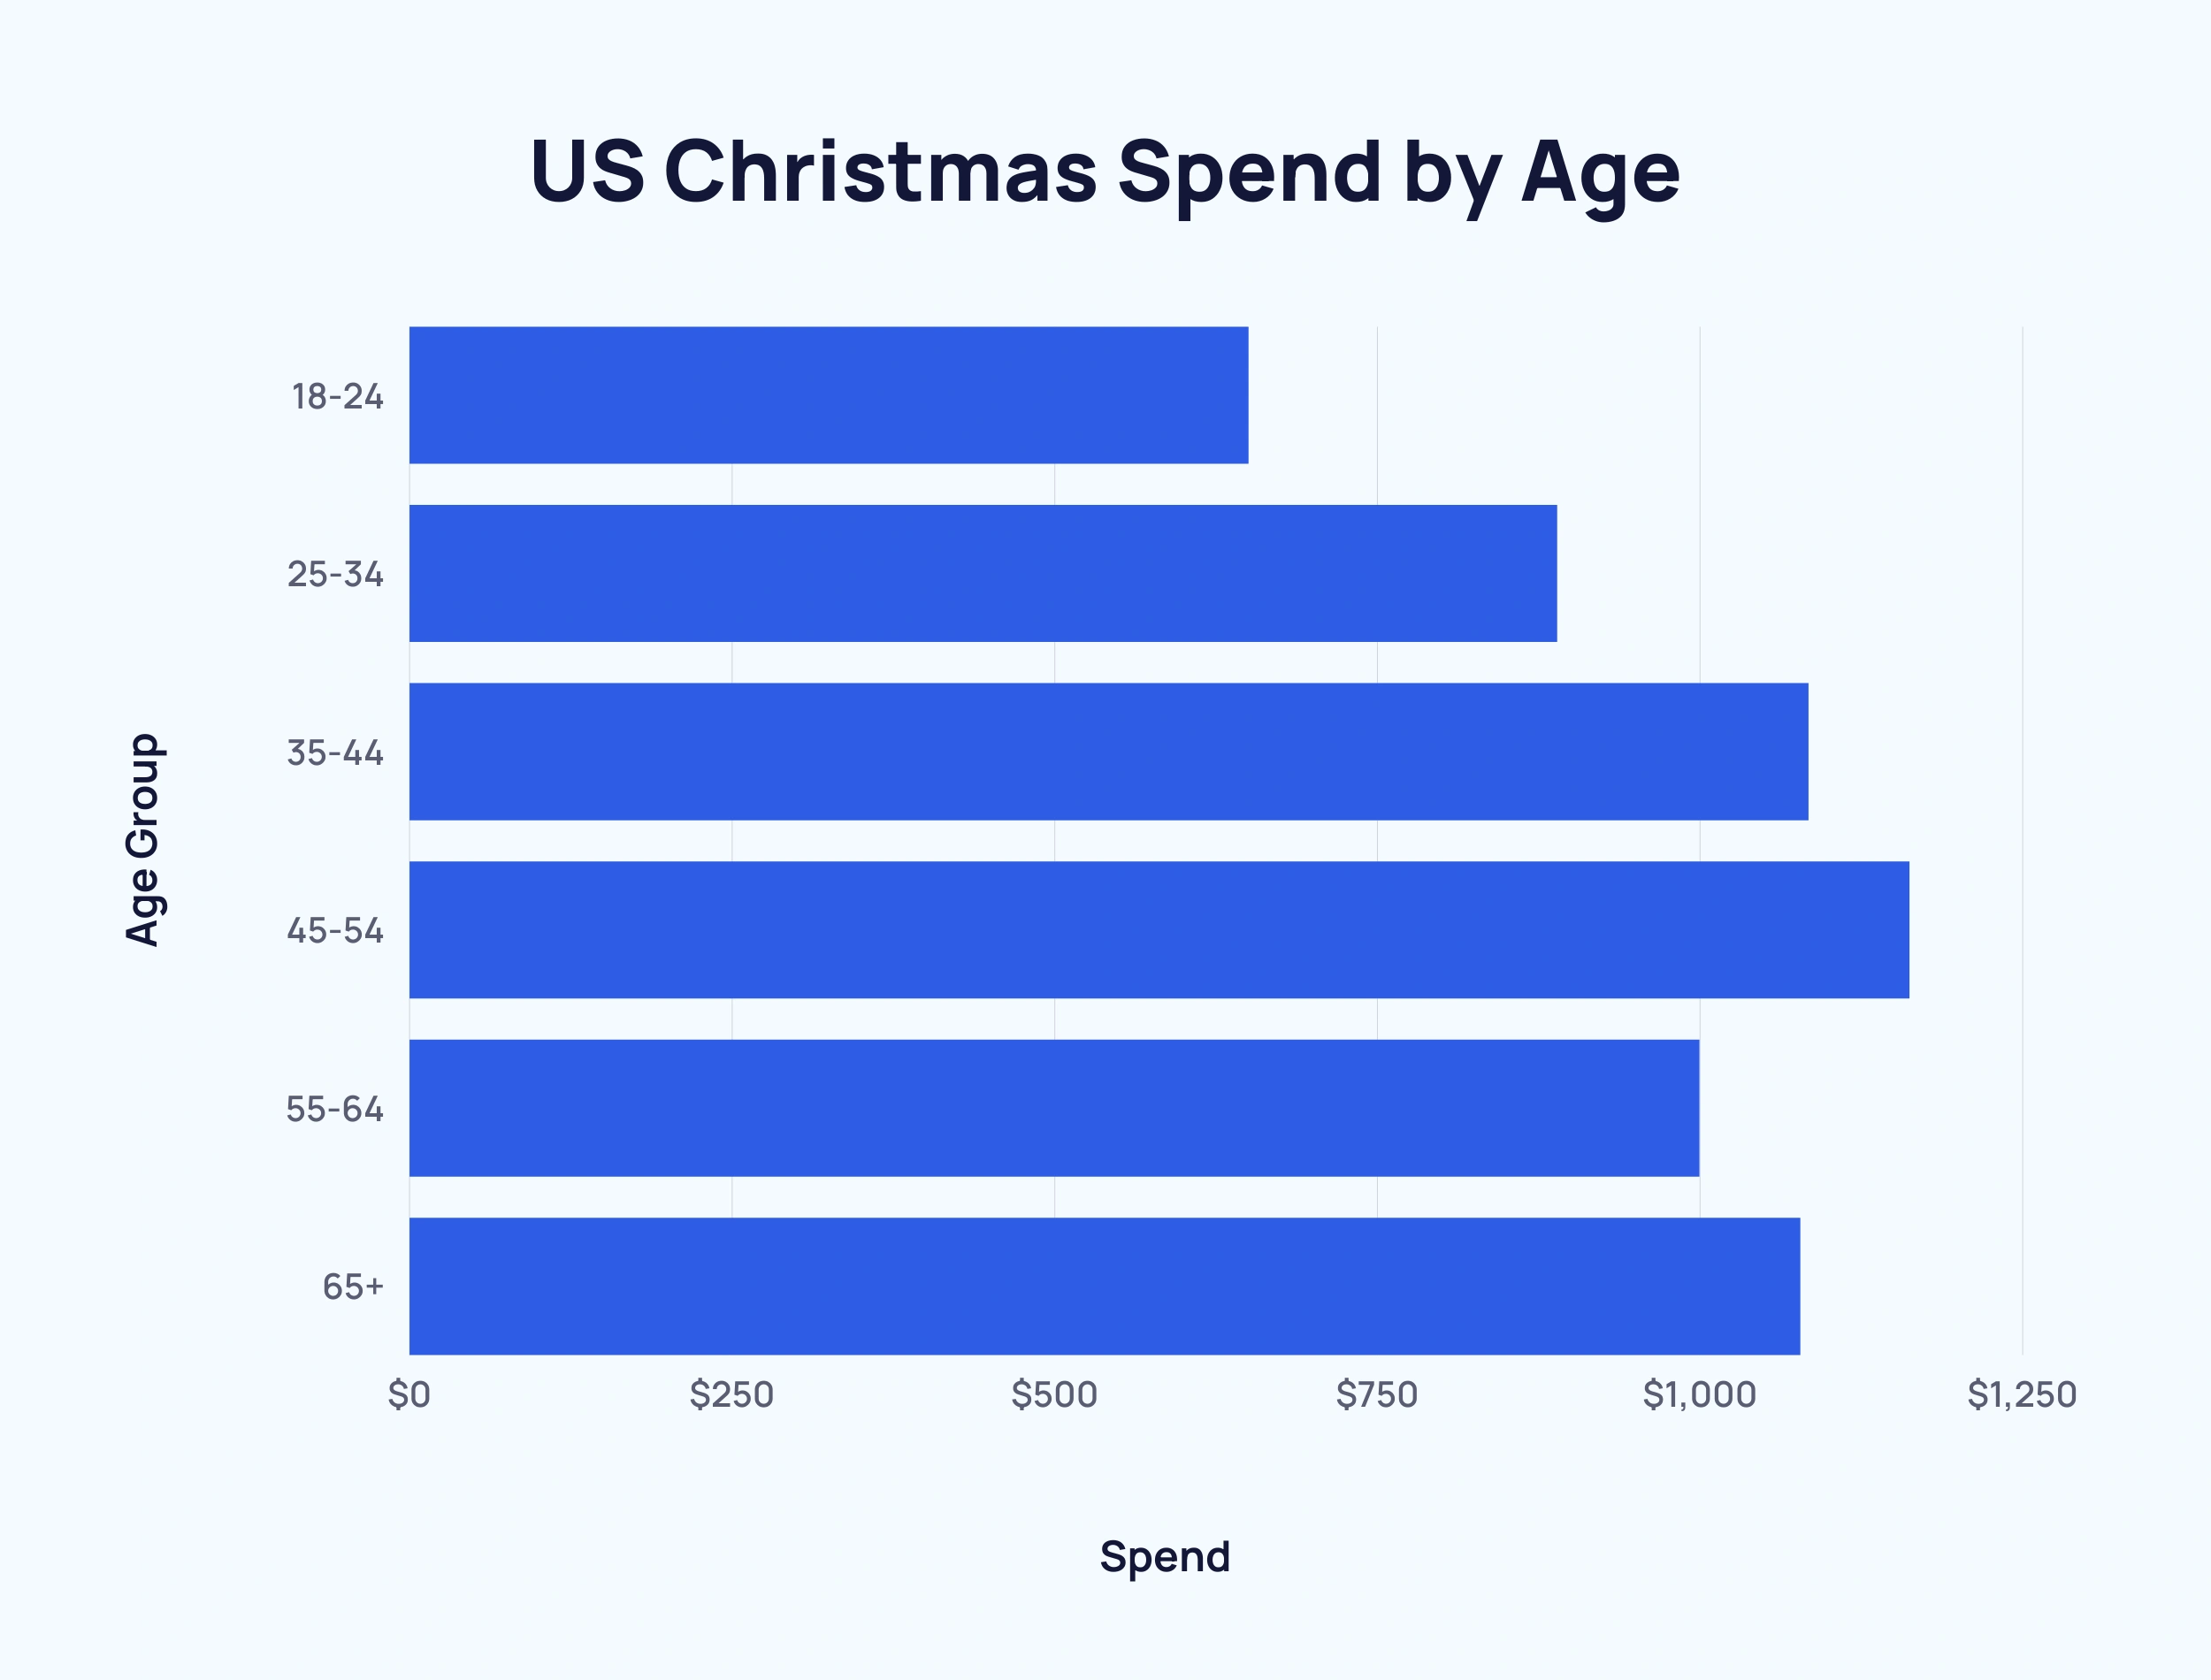
Here’s the data:
| Age Group | Spend |
| 18-24 | $649.81 |
| 25-34 | $888.98 |
| 35-44 | $1,083.74 |
| 45-54 | $1,161.98 |
| 55-64 | $999.22 |
| 65+ | $1,077.41 |
Between 95% and 97% of each age group buy gifts for their families.
Buying gifts for friends decreases consistently with age. At 18-24, 80% of Americans buy gifts for friends. By 45-54, this figure drops to 71%. And at 65+, just 56% buy Christmas presents for their friends.
Purchasing gifts for coworkers increases gradually from 37% to 42% to 46% in the first three age groups. But that quickly drops to 38%, then 22%, then 6% thereafter.
A similar, but less drastic pattern can be seen for other gifts, with the peak figure of 47% coming at 35-44.
Decorations are predominantly bought by under-55s, with between 73% and 80% of each age group getting involved. Less than half (49%) of 65+ year-olds buy Christmas decorations.
Greetings card purchases seem to increase with age – 57% of 18 to 24-year-olds buy Christmas cards, compared to 70% of 35 to 44-year-olds and 75% of Americans aged 65+.
Little difference is seen between age groups for purchasing habits of candy & food (each between 88% and 94%). As is the case with flowers (40% to 52%).
Spending on non-gifts significantly decreases in the latter three age groups, down from 60% for 35 to 44-year-olds to 29% for people aged 65+.
US Christmas Spend by Region
Split across four regions (Northeast, Midwest, South, and West), the US is fairly evenly distributed in terms of Christmas spending.
There is less than a $100 difference between the biggest average spenders in the Northeast ($1,054.35) and the lowest in the South ($954.52).
The second-highest spenders reside in the West ($1,017.20). Meanwhile, the Midwest averages a holiday spend of ($995.68).
Here are the most notable takeaways from regional purchasing figures:
- The vast majority (96%) of residents in each region buy gifts for their families
- 46% of the Northeast purchase other gifts compared to 39% of the West
- 4 to 5% more people in the Northeast buy greeting cards than the rest of the US
- At least 90% of each region purchases candy & food
- 49% of the West buy flowers compared to 40% of the Midwest
- The Northeast ranked highest in 5 of 9 spending categories
- The Midwest ranked lowest in 5 of 9 spending categories
Source: National Retail Federation
Holiday Gift Type by Demographic
Christmas Gift Preference by Gender
On average, US men and women have significant differences in Christmas gift preferences.
Despite this, gift cards ranked first as the preferred type of Christmas gift for both men and women. And clothing & accessories were second for both, too.
Here’s a breakdown of how popular each type of gift is for both men and women in the US:
| Gift Type | Rank (Men) | Popularity (Men) | Rank (Women) | Popularity (Women) | Difference |
| Gift cards | 1 | 48% | 1 | 64% | 16% (W) |
| Clothing & accessories | 2 | 44% | 2 | 50% | 6% (W) |
| Books & other media | =3 | 33% | 3 | 32% | 1% (M) |
| Electronics & accessories | =3 | 33% | 7 | 20% | 13% (M) |
| Sporting goods | 5 | 23% | 9 | 10% | 13% (M) |
| Home improvement items | 6 | 19% | 8 | 14% | 5% (M) |
| Home decor & furnishings | 7 | 15% | 4 | 31% | 16% (W) |
| Jewelry | 8 | 12% | 6 | 28% | 16% (W) |
| Personal care & beauty | 9 | 10% | 5 | 30% | 20% (W) |
| Other | 10 | 7% | 10 | 7% | 0% |
Christmas Gift Preference by Age
Age also appears to significantly affect Christmas gift preferences in the US.
On average, more young adults want clothing & accessories. The percentage of people who would like clothes decreases at a fairly consistent rate from 65% in the 18-24 years category to 30% in the 65+.
This is also the case with books & other media, decreasing with each advancing age category from 43% to 25%.
In fact, this trend can be seen across 5 of 10 categories. Electronics & accessories drop from 38% to 12%. Home decor & furnishings fall from 33% to 10%. And jewelry drops from 32% to 12%.
A preference for sporting goods remains fairly stable (between 22% and 23%) for the youngest three age categories (18 to 24, 25 to 34, 35 to 44). However, it drops thereafter, falling to 8% for the 65+ category.
Home improvement items have a stable preference across the board at 14% to 22% for under 64s.
The final two categories each see increasing desire with age.
Gift cards rise with each age group, from 25 to 34-year-olds at 49% to 65+ at 63%. And the other category has its highest three percentages in ascending order of the oldest three age groups, peaking at 14%.
Christmas Gift Preference by Region
In terms of demographics, US regions appear to have the least influence over gift preference.
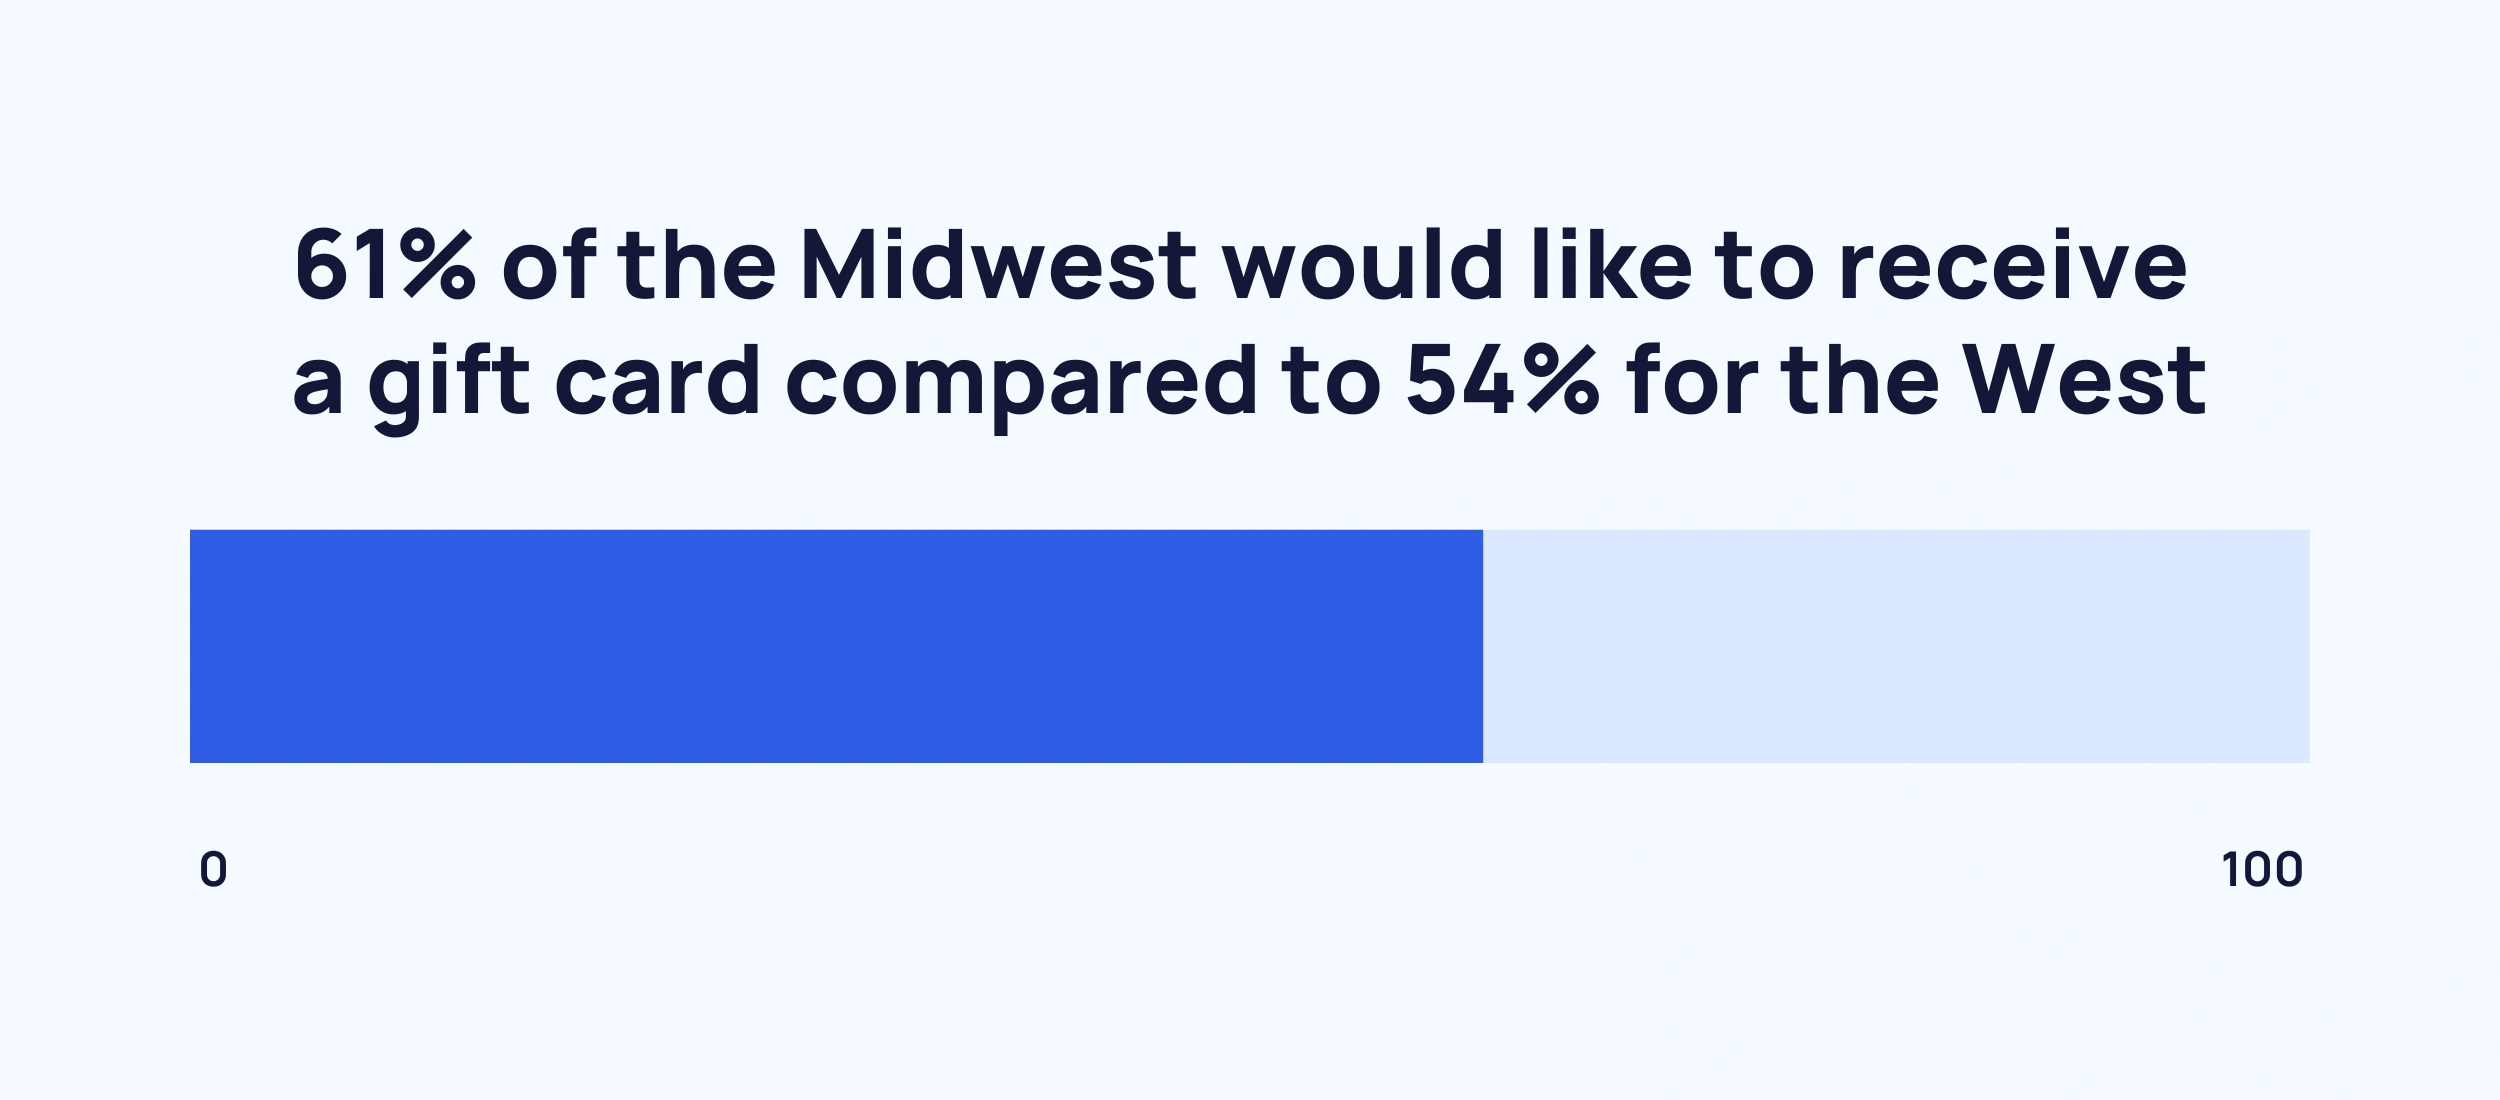
Only one gift category has a difference in gift preference greater than 5% – gift cards. 61% of the Midwest would like to receive a gift card compared to 54% of people living in the West.
The average percentage of Americans who said they would like a gift from any given category is as follows:
- Midwest – 27.3%
- South – 26.6%
- West – 26.5%
- Northeast – 26%
Source: National Retail Federation
US Holiday Shopping Preferences
As of 2024, holiday spending is down in five of eight retail categories.
Here's a look at how each retail category has changed between 2023 and 2024:
| Gift Category | 2023 Spending | 2024 Spending Projection | Difference | Percentage of Shoppers | Share of Spend |
| Clothing and accessories | $309 | $279 | ↓ 9.7% | 71% | 21% |
| Food and beverage | $242 | $238 | ↓ 1.7% | 63% | 16% |
| Electronics and accessories | $261 | $265 | ↑ 1.5% | 52% | 14% |
| Toys and hobbies | $222 | $202 | ↓ 9% | 67% | 14% |
| Gift cards | $300 | $263 | ↓ 12.3% | 47% | 13% |
| Health and wellness | $193 | $203 | ↑ 5.2% | 46% | 10% |
| Home and kitchen | $198 | $194 | ↓ 2% | 40% | 8% |
| Pet | $118 | $115 | ↓ 2.5% | 39% | 5% |
Almost 2 in 3 Americans start Christmas shopping before the end of November (65%).
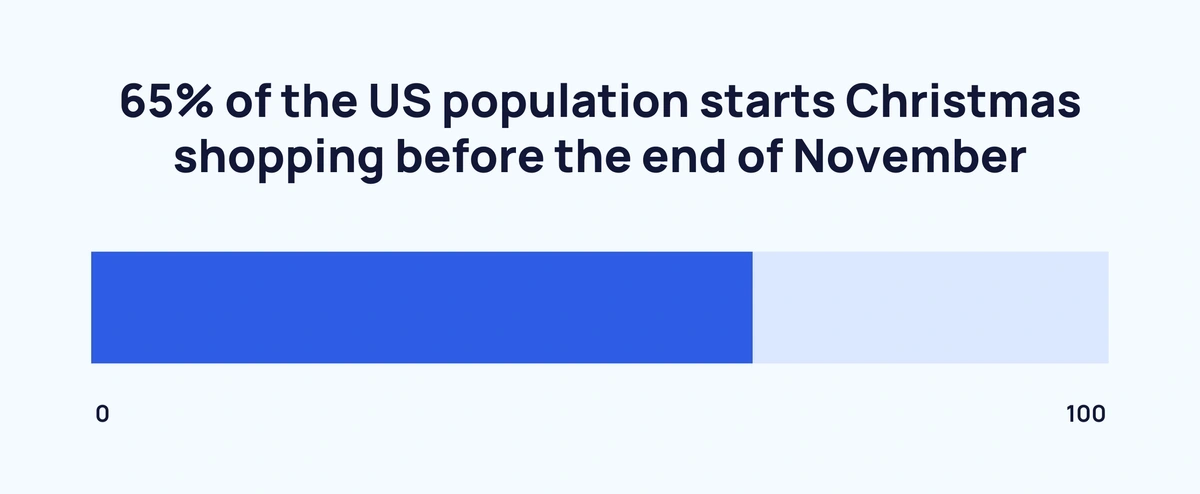
Here's a breakdown of when Americans start and end holiday shopping:
| When | Proportion Shopping for Christmas |
| October or earlier | 20% |
| November | 45% |
| December | 34% |
Around 1 in 3 (34%) of US citizens wait until December to buy holiday-related items. And unsurprisingly, just 1% do their Christmas shopping after the fact in January.
Where US consumers shop also varies considerably.
Almost half of Americans do some of their Christmas shopping on a smartphone (48%).
Here are those figures broken down by generation:
| Generation | Smartphone Shopping |
| Gen Z | 58% |
| Millennials | 62% |
| Gen X | 47% |
| Baby Boomers | 30% |
| Average | 48% |
Social media has become an increasingly important part of festive shopping, particularly for younger generations.
Around 1 in 3 people (34%) now plan to use social media for holiday shopping.
Here's how social media usage for Christmas shopping varies between generations:
| Year | Gen Z | Millennials | Gen X | Boomers | Seniors |
| 2020 | 46% | 44% | 22% | 10% | 9% |
| 2021 | 49% | 46% | 25% | 12% | 10% |
| 2022 | 60% | 56% | 28% | 15% | 9% |
In total, 64% of Americans agree that sales or price discounts are important when Christmas shopping.
More than half of US citizens also think that the quality of merchandise (58%) and the selection of merchandise (57%) are important.
Layaway services are deemed the least important (4%) aspect of holiday shopping.
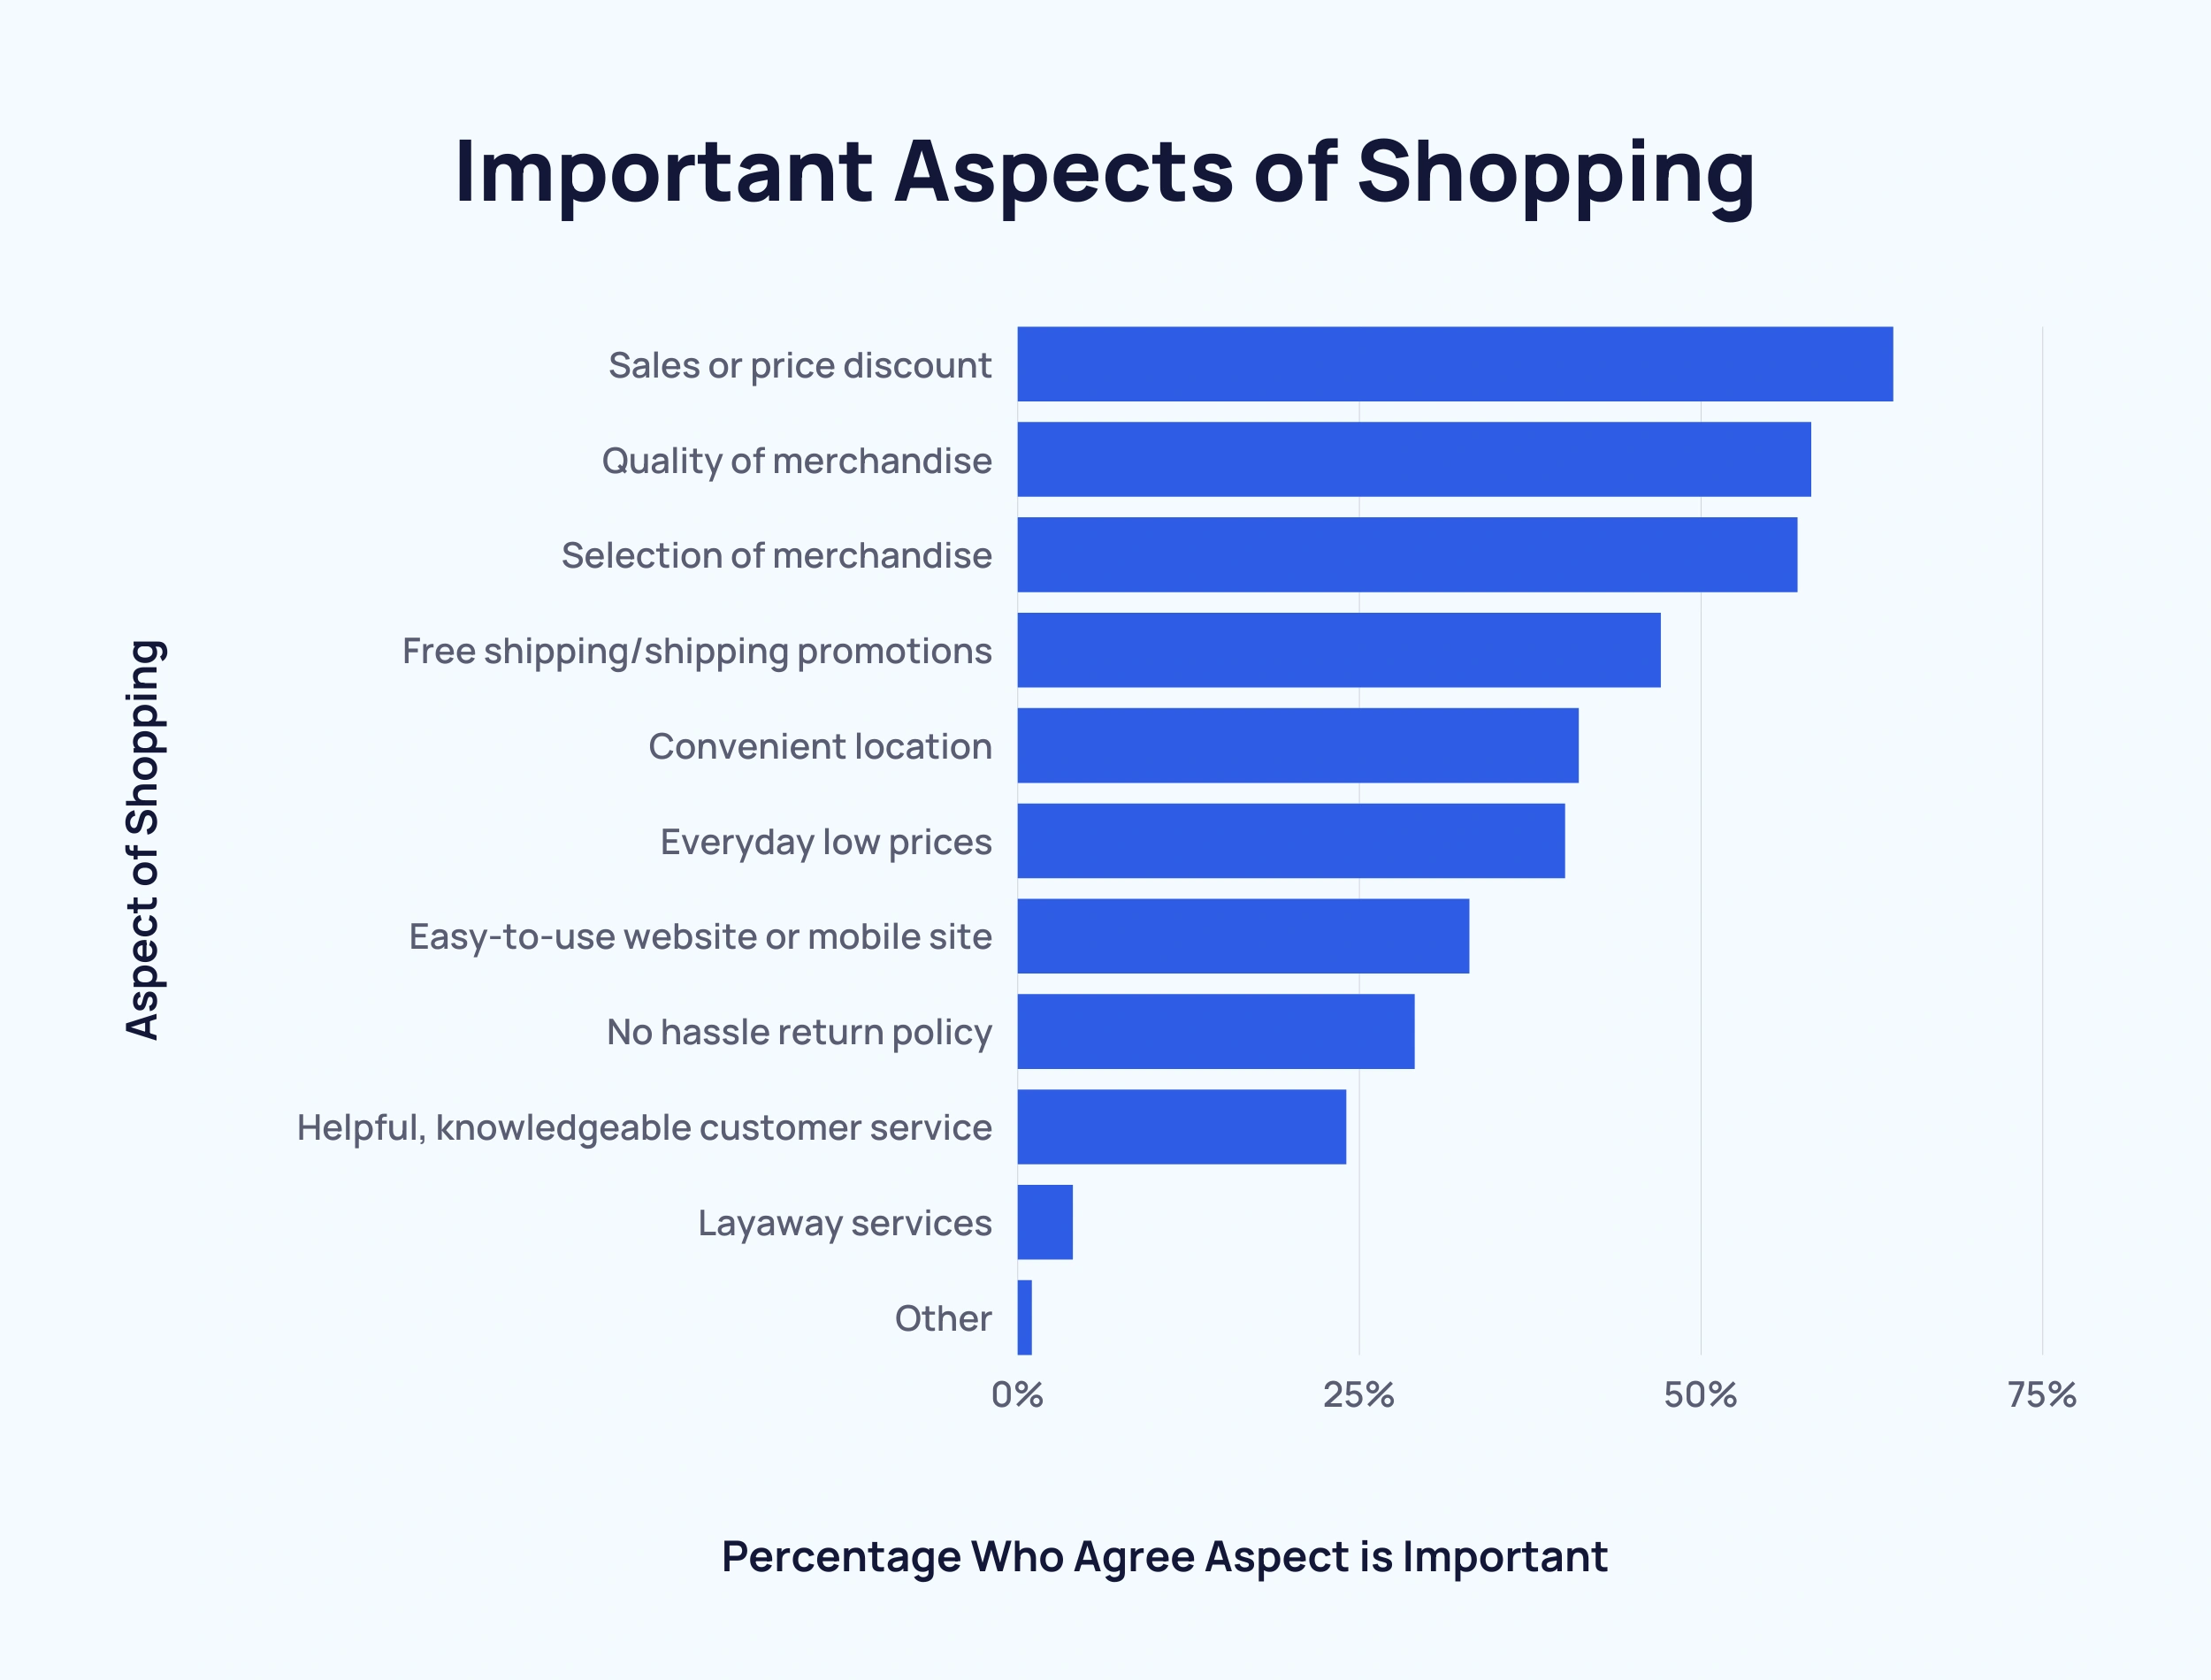
These are the full results of the 2021 survey:
| Rank | Aspect of Shopping | Percentage Who Agree Aspect is Important |
| 1 | Sales or price discount | 64% |
| 2 | Quality of merchandise | 58% |
| 3 | Selection of merchandise | 57% |
| 4 | Free shipping/shipping promotions | 47% |
| 5 | Convenient location | 41% |
| 6 | Everyday low prices | 40% |
| 7 | Easy-to-use website or mobile site | 33% |
| 8 | No hassle return policy | 29% |
| 9 | Helpful, knowledgeable customer service | 24% |
| 10 | Layaway services | 4% |
| 11 | Other | 1% |
Sources: Deloitte, National Retail Federation
Key Takeaways
The holiday season is evidently an expensive time for the average American. And a lucrative time for business.
Data suggests that spending is likely to continue as long as the global economy remains relatively stable.
If you found our stats on American Christmas spending interesting, give our important shopping trends and retail trends a go.